
















©The Author(s) 2025.
World J Gastrointest Oncol. Dec 15, 2025; 17(12): 114037
Published online Dec 15, 2025. doi: 10.4251/wjgo.v17.i12.114037
Published online Dec 15, 2025. doi: 10.4251/wjgo.v17.i12.114037
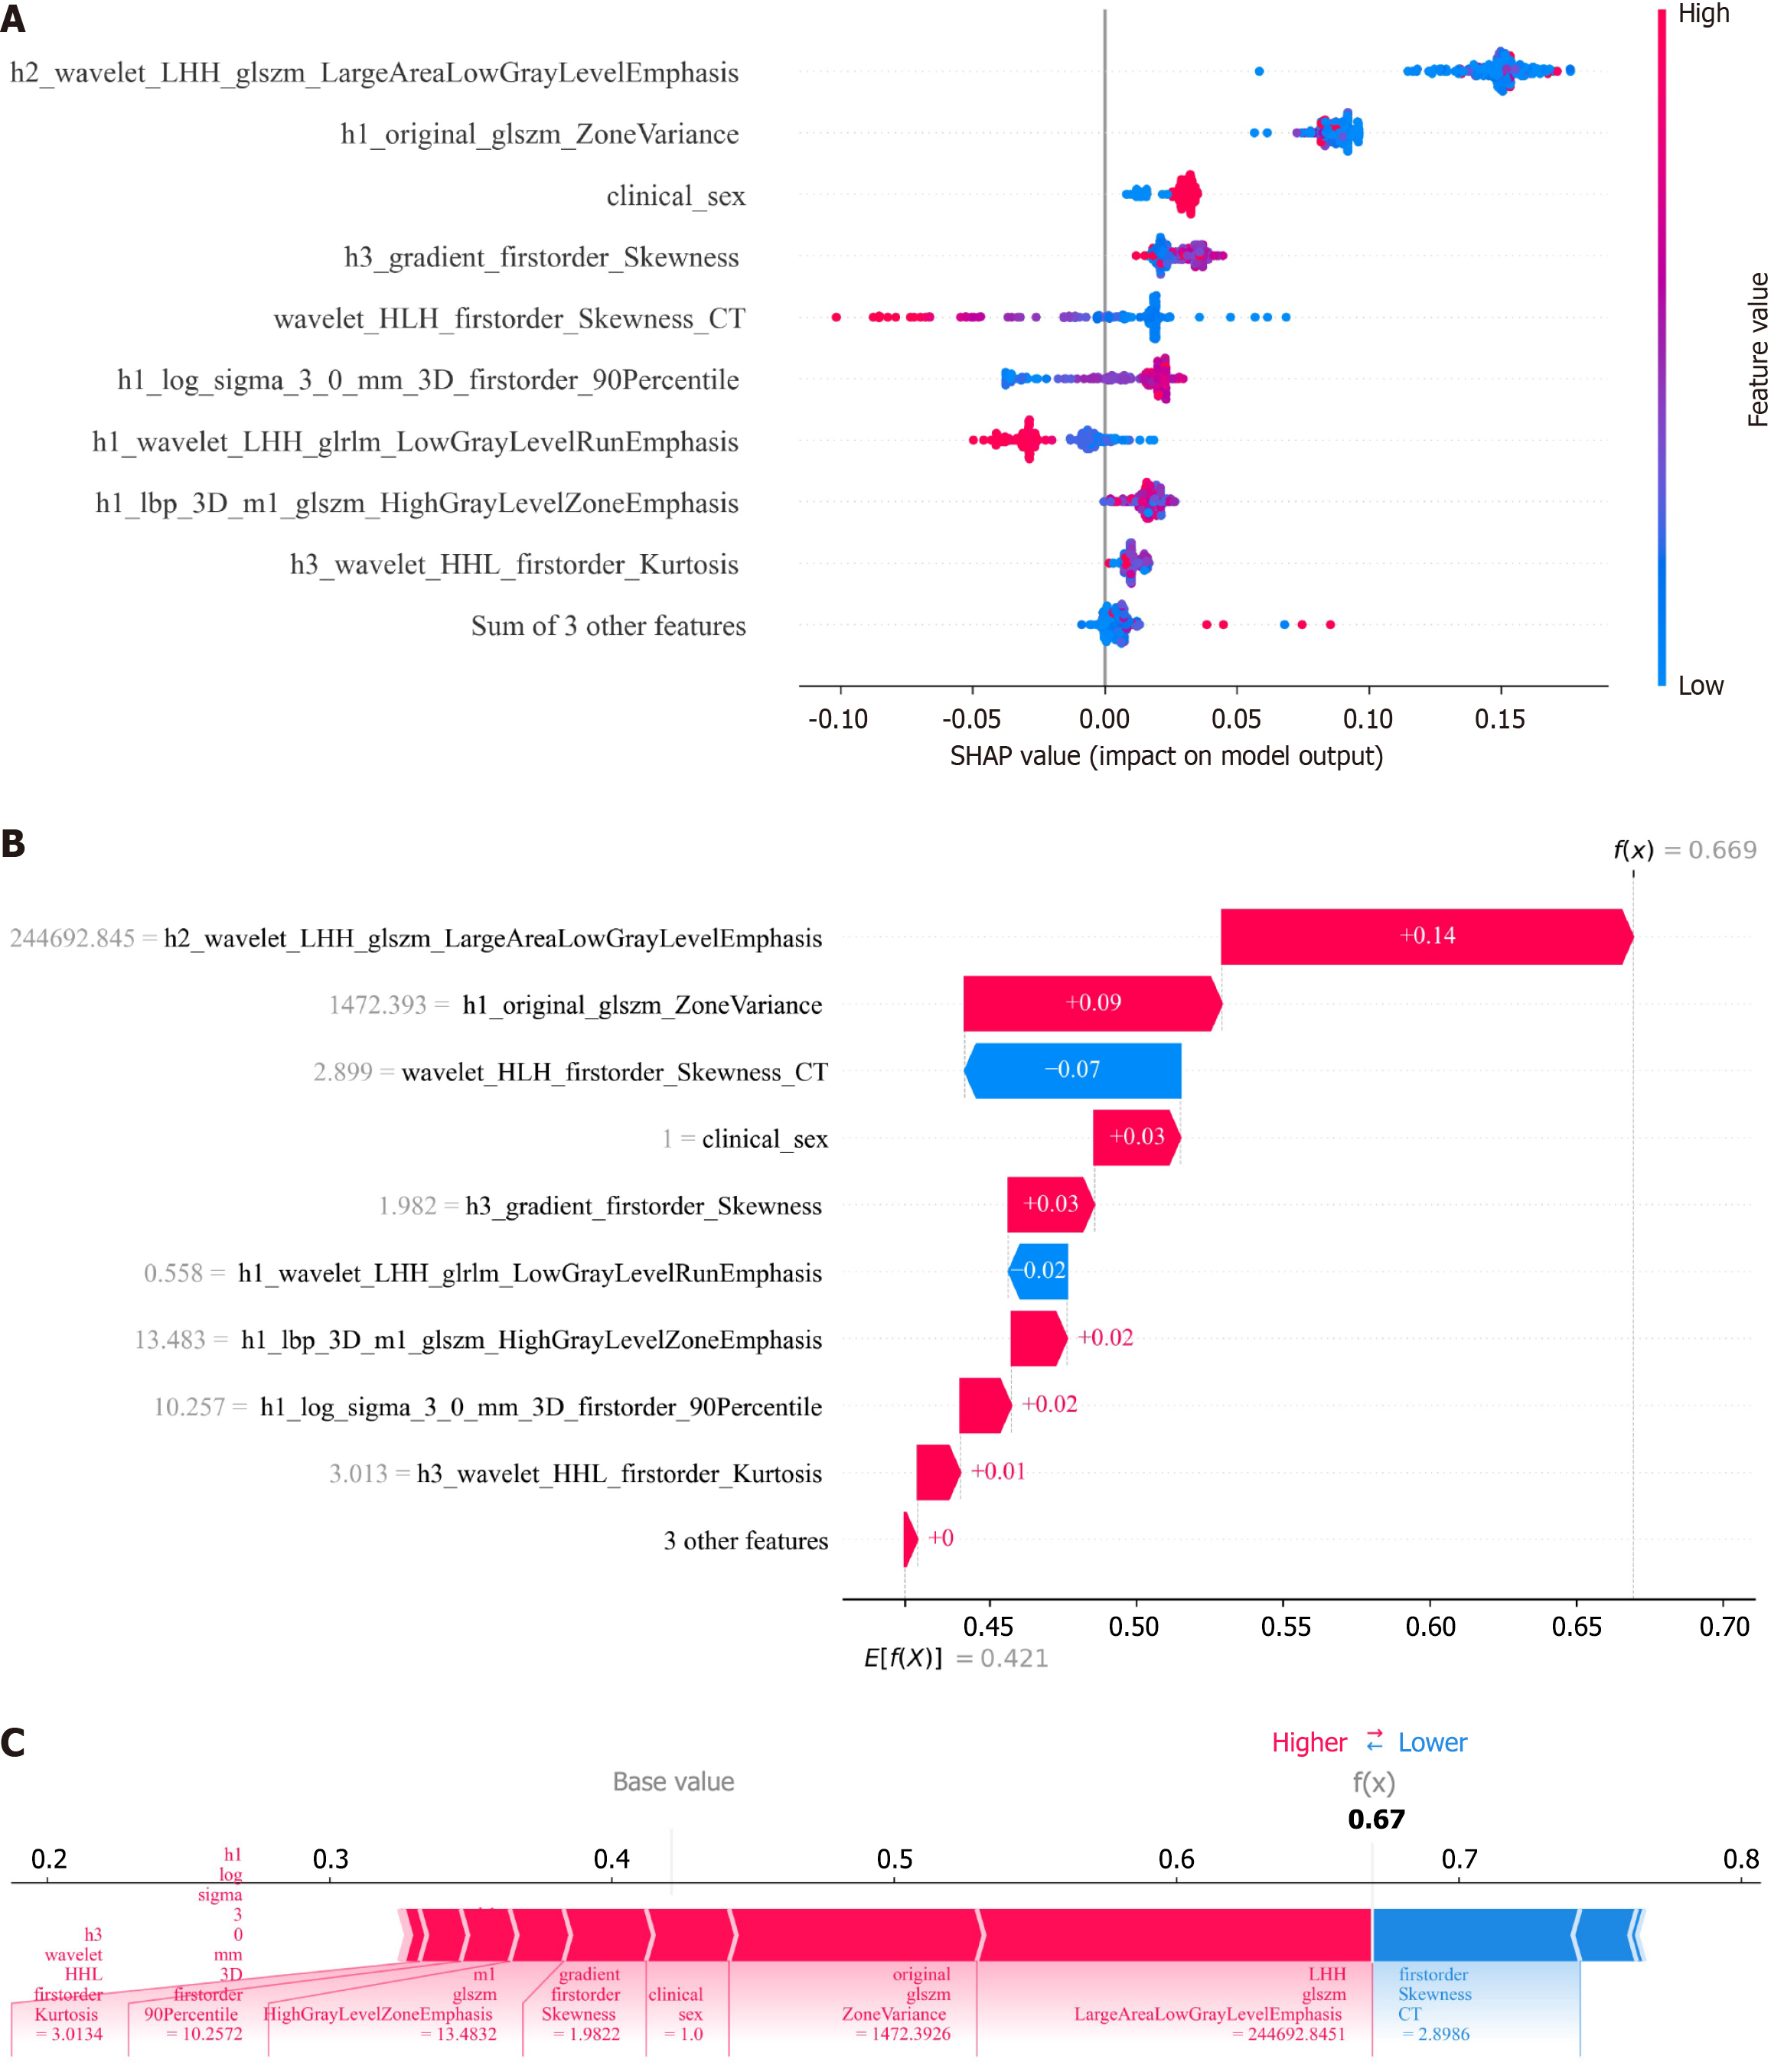
Figure 5 SHapley Additive exPlanations analysis plot.
A: SHapley Additive exPlanations adds feature importance explanations, represented by the average absolute shape value for each feature; B: The shape summary plot displays the distribution of shape values for each feature across patients. Each point corresponds to the shape value of a specific feature for each patient. The X-axis represents shape values, with colors ranging from red (high feature value) to blue (low feature value); C: Shape plots for patients with and without recurrence. Colors indicate each feature's contribution (red for positive, blue for negative), while bar length reflects contribution strength. SHAP: SHapley Additive exPlanations; CT: Computed tomography.
- Citation: Huang LH, Fang YJ, Zheng XJ, Huang C, Li CL, Yu B, Huang MJ, Qin SJ, Huang DY, Lu DW. Application of multimodal fusion technology in early recurrence prediction and pathological analysis of hepatocellular carcinoma. World J Gastrointest Oncol 2025; 17(12): 114037
- URL: https://www.wjgnet.com/1948-5204/full/v17/i12/114037.htm
- DOI: https://dx.doi.org/10.4251/wjgo.v17.i12.114037