
















©The Author(s) 2025.
World J Gastrointest Oncol. Dec 15, 2025; 17(12): 114037
Published online Dec 15, 2025. doi: 10.4251/wjgo.v17.i12.114037
Published online Dec 15, 2025. doi: 10.4251/wjgo.v17.i12.114037
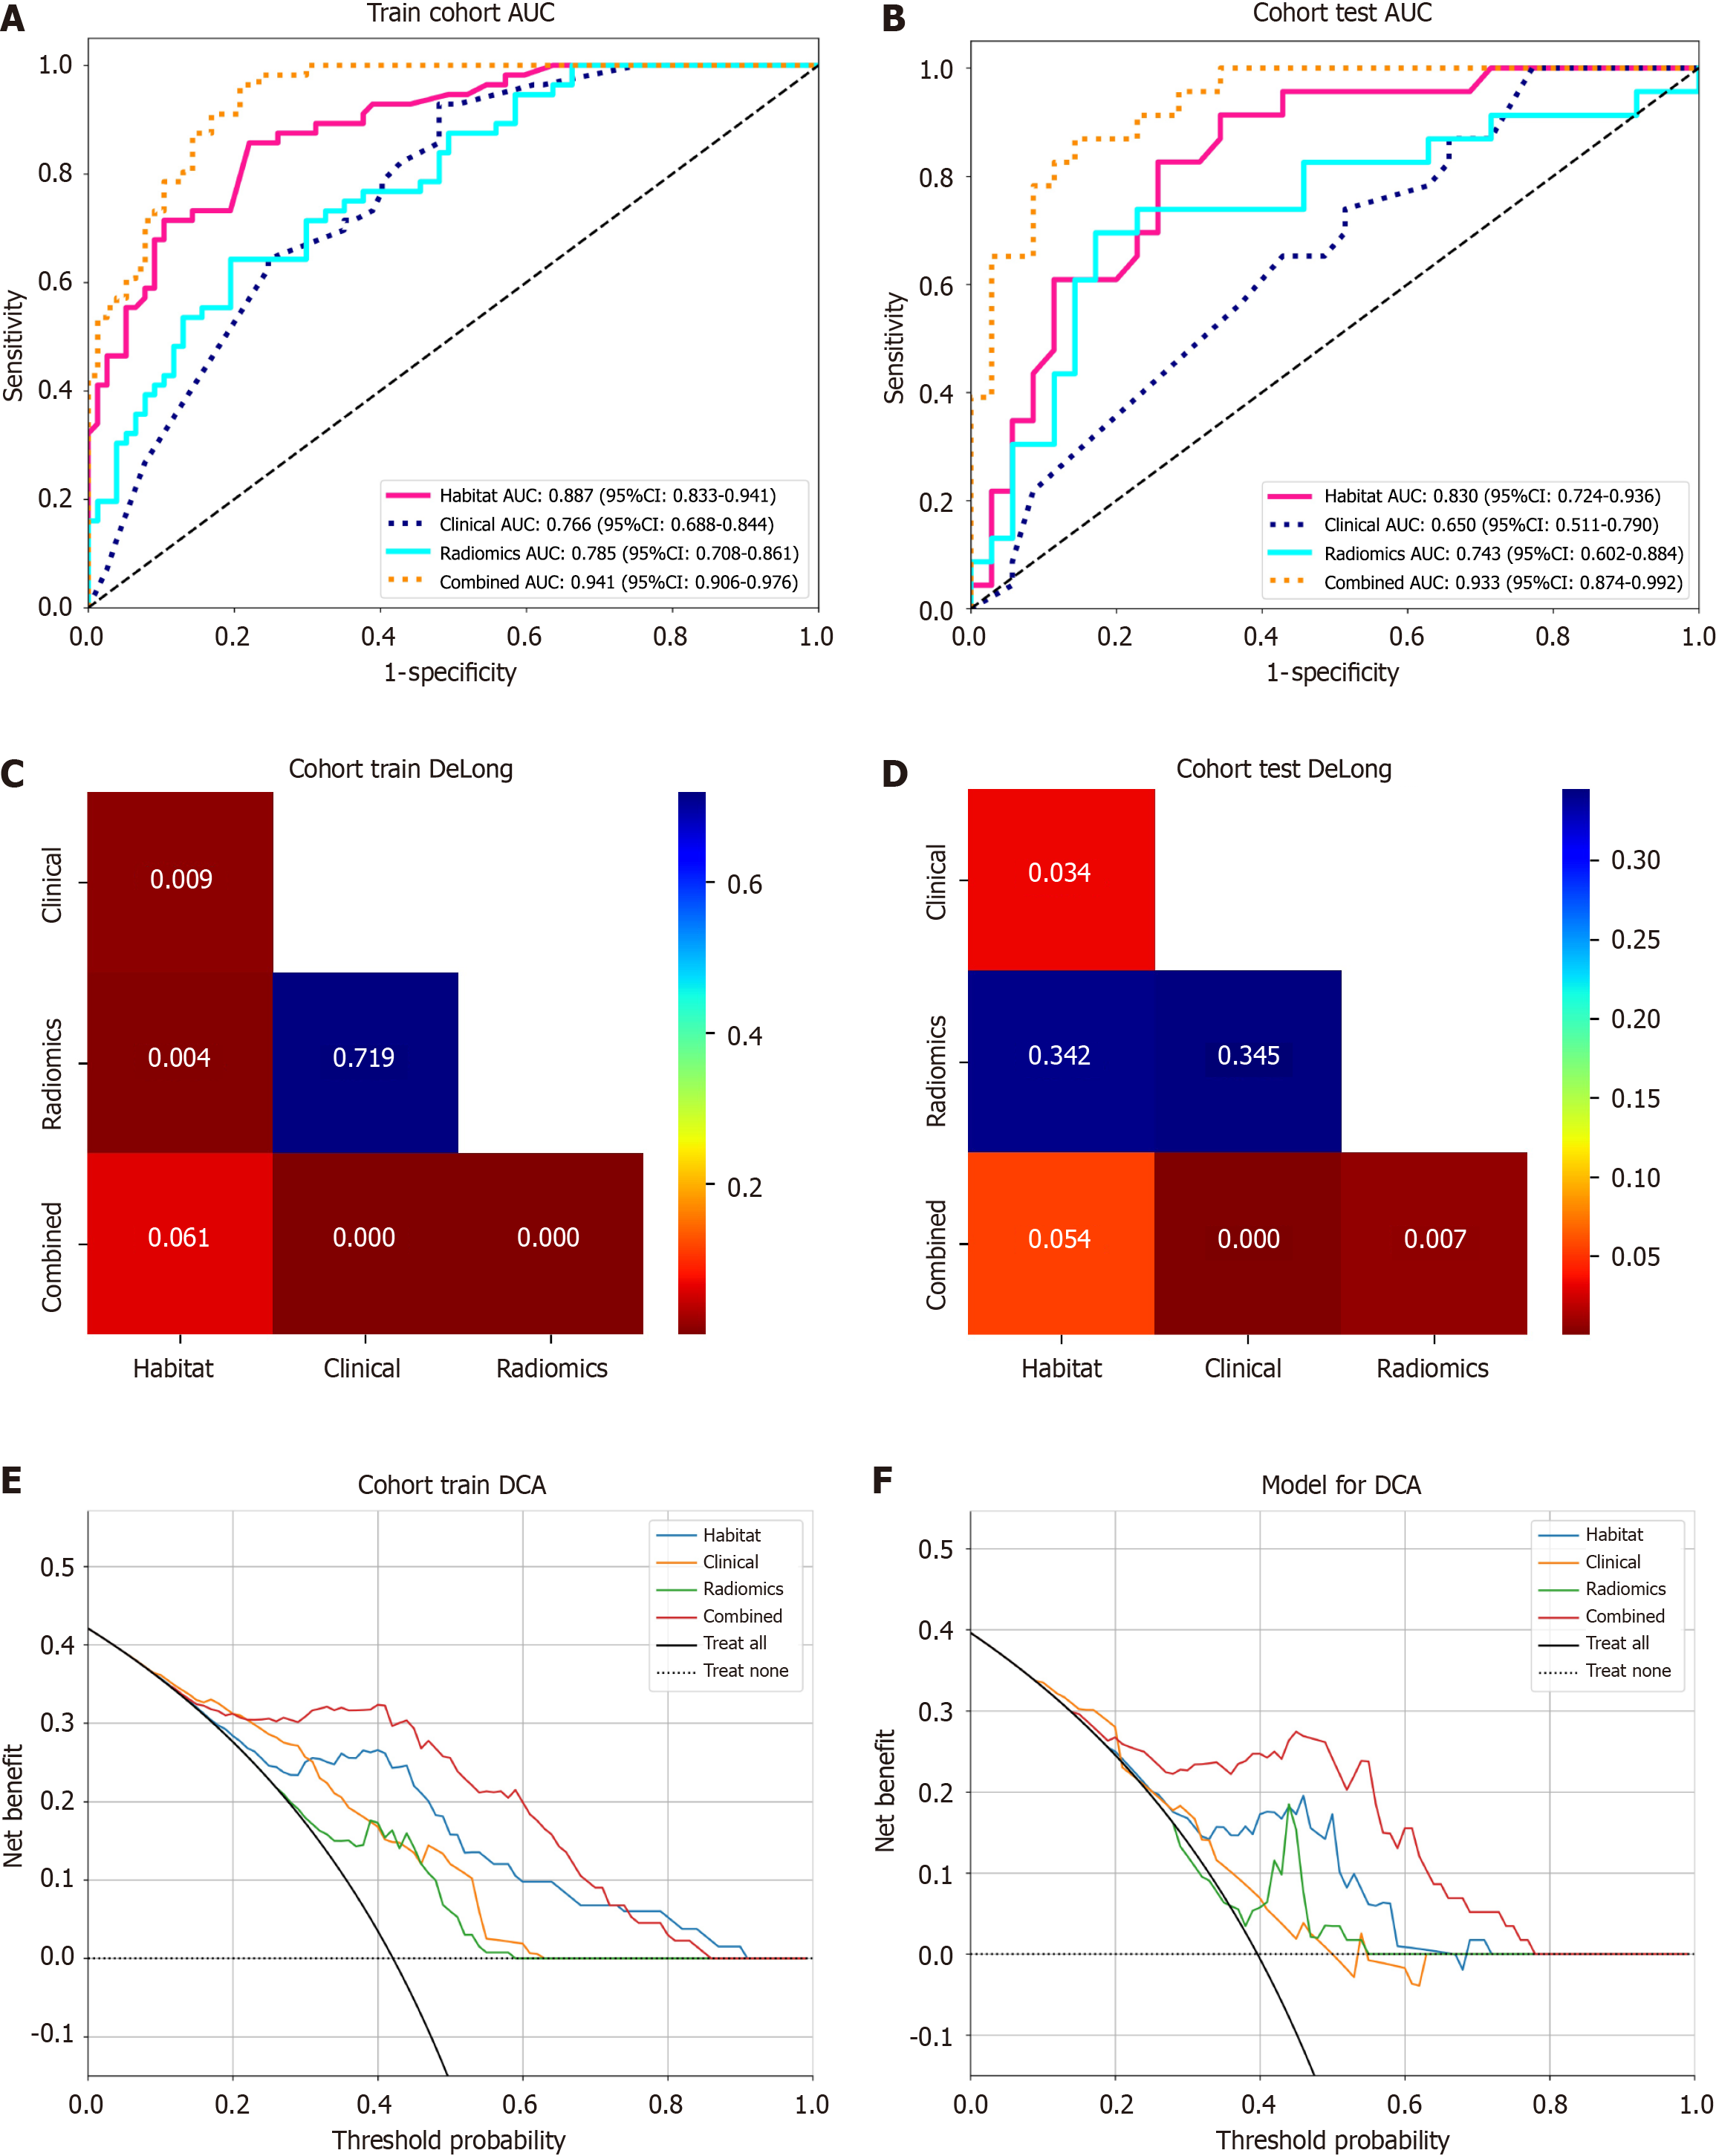
Figure 4 Receiver operating characteristic curves and decision curve analysis for subjects with different characteristics.
A and B: Receiver operating characteristic curves for the training and testing sets, where yellow, red, cyan, and dark blue represent fusion features, habitat features, radiomics features, and clinical features, respectively; C and D: Delong test analysis for the training and testing sets; E and F: Decision curve analysis for the training and testing sets. Red, blue, green, and yellow represent the integrated model, habitat model, traditional radiomics model, and clinical model, respectively. AUC: Area under the curve; DCA: Decision curve analysis.
- Citation: Huang LH, Fang YJ, Zheng XJ, Huang C, Li CL, Yu B, Huang MJ, Qin SJ, Huang DY, Lu DW. Application of multimodal fusion technology in early recurrence prediction and pathological analysis of hepatocellular carcinoma. World J Gastrointest Oncol 2025; 17(12): 114037
- URL: https://www.wjgnet.com/1948-5204/full/v17/i12/114037.htm
- DOI: https://dx.doi.org/10.4251/wjgo.v17.i12.114037