
















©The Author(s) 2025.
World J Gastrointest Oncol. Dec 15, 2025; 17(12): 113976
Published online Dec 15, 2025. doi: 10.4251/wjgo.v17.i12.113976
Published online Dec 15, 2025. doi: 10.4251/wjgo.v17.i12.113976
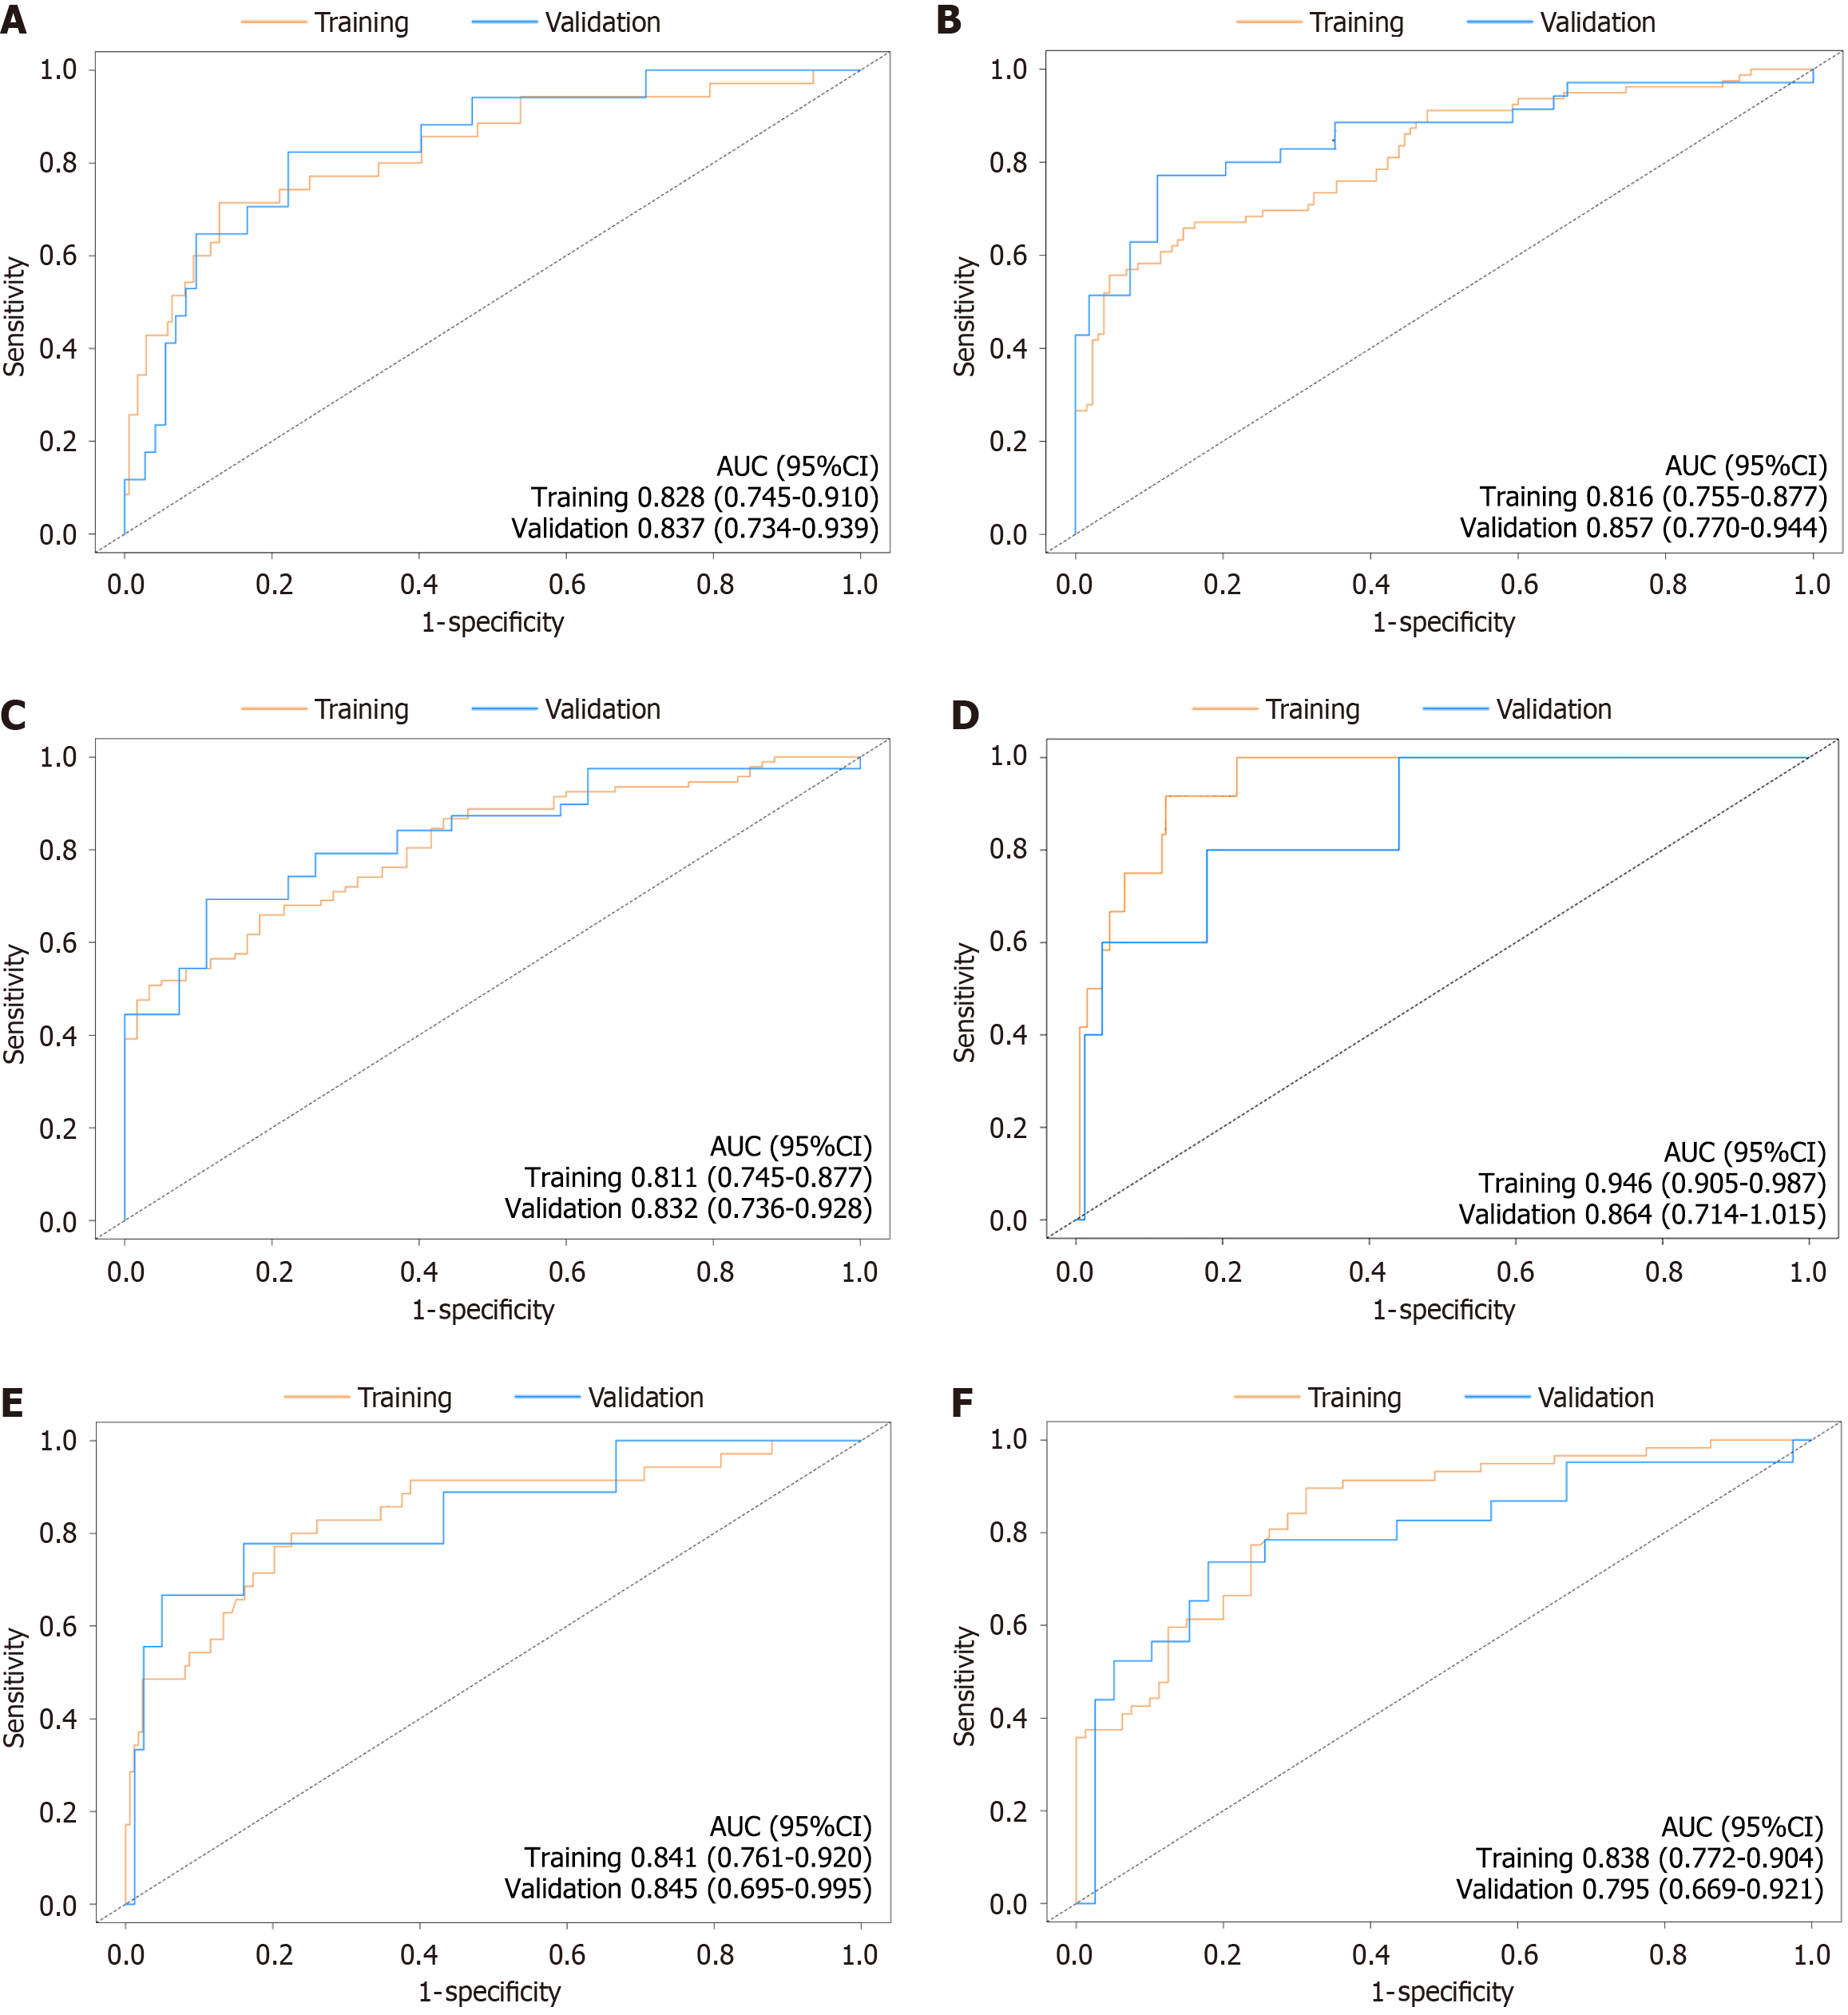
Figure 4 Graph depicting the operating characteristic evaluation plot for prognostic models.
A: Graph showing the training set and validation receiver operating characteristic (ROC) evaluation plots for 1-year disease-free survival (DFS) prognostic prediction model; B: Graph showing the training set and validation set ROC evaluation plots for 3-year DFS prognostic prediction model; C: Graph showing the training set and validation set ROC evaluation plots for 5-year DFS prognostic prediction model; D: Graph showing the training set and validation set ROC evaluation plots for 1-year overall survival (OS) prognostic prediction model; E: Graph showing the training set and validation set ROC evaluation plots for 3-year OS prognostic prediction model; F: Graph showing the training set and validation set ROC evaluation plots for 5-year OS prognostic prediction model. AUC: Area under the curve; CI: Confidence interval.
- Citation: Hao QL, Yao ZY, Shen YM, Li ZY, Gao HC, Hong XY, Li GC, Gao C. Prognostic significance of preoperative C-reactive protein-triglyceride-glucose index in long-term outcomes after radical gastrectomy for gastric cancer. World J Gastrointest Oncol 2025; 17(12): 113976
- URL: https://www.wjgnet.com/1948-5204/full/v17/i12/113976.htm
- DOI: https://dx.doi.org/10.4251/wjgo.v17.i12.113976