
















©The Author(s) 2025.
World J Gastrointest Oncol. Dec 15, 2025; 17(12): 112873
Published online Dec 15, 2025. doi: 10.4251/wjgo.v17.i12.112873
Published online Dec 15, 2025. doi: 10.4251/wjgo.v17.i12.112873
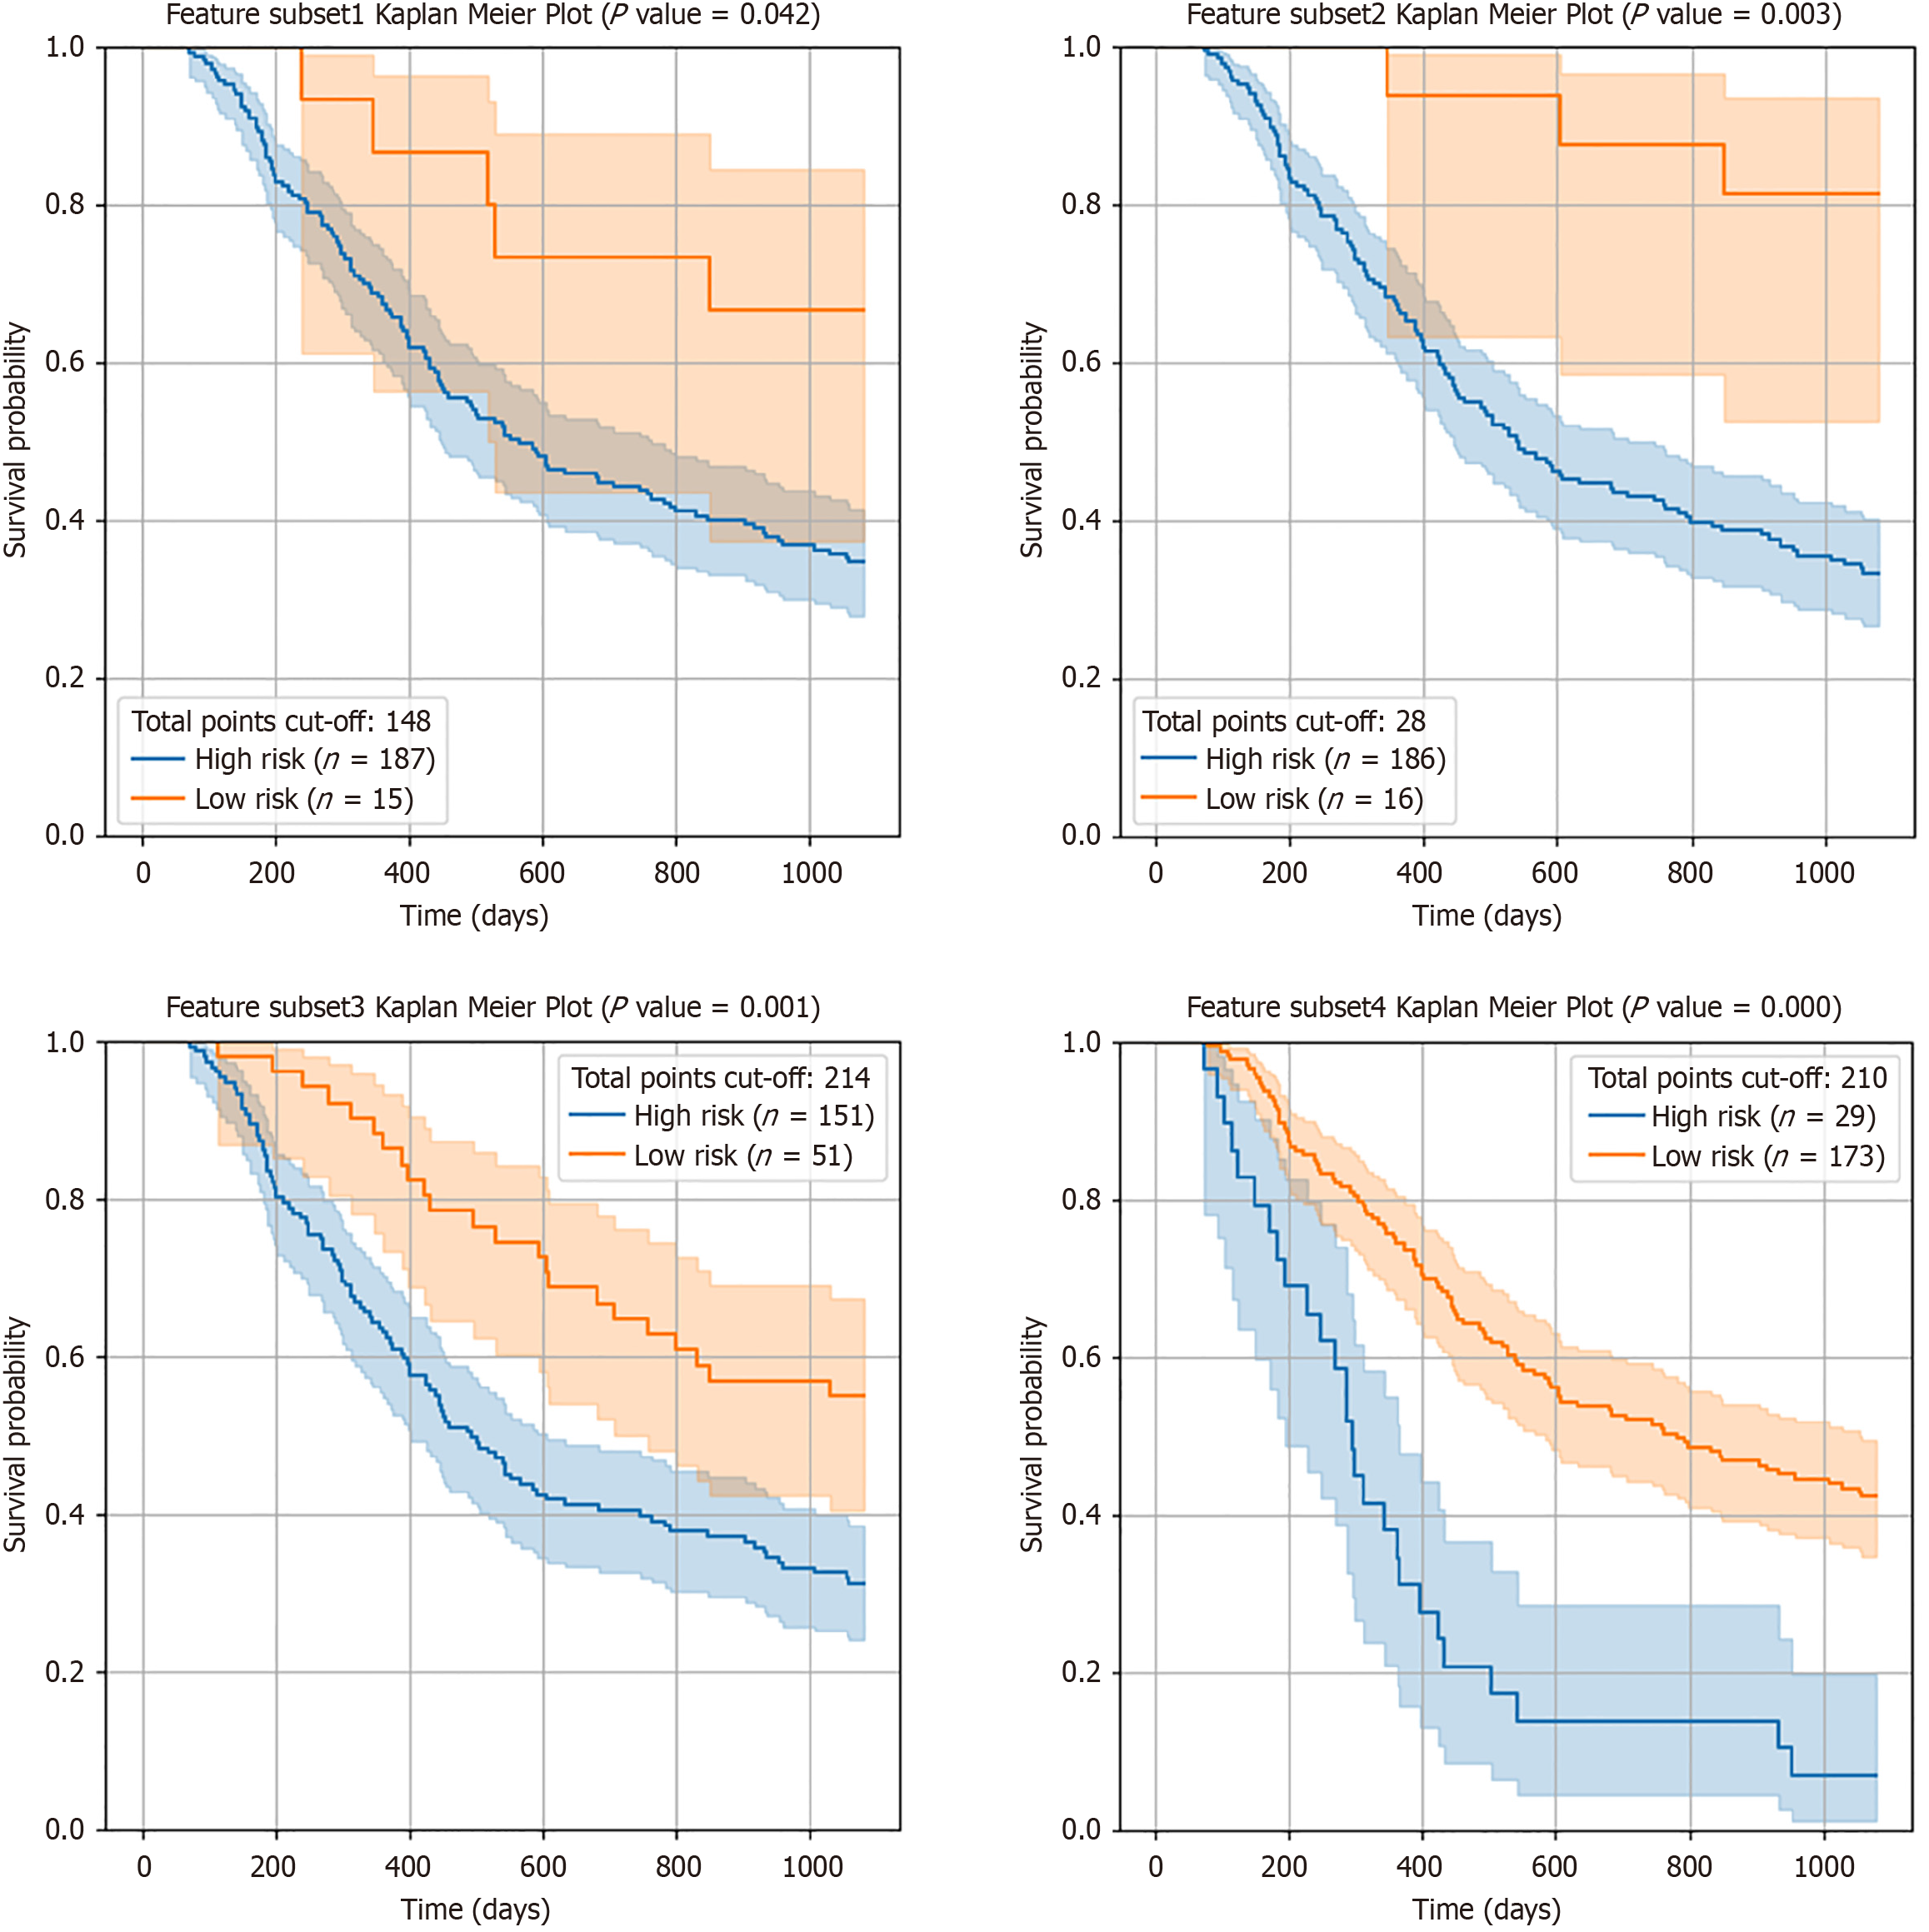
Figure 5 Results of the Kaplan-Meier survival analyses of 2-year survival rates according to the risk in feature subset 1 (upper left), feature subset 2 (lower left), feature subset 3 (upper right) and feature subset 4 (lower right) as input data.
The blue and orange lines represent patients classified as high-risk and low-risk for 2-year survival, respectively, based on the total points from the nomogram.
- Citation: Liu MC, Cheng YY, Lin SC, Lin CH, Chuang CY, Chen WH, Liao CH, Hsieh CH, Hsieh MF, Liu YJ. Machine learning survival prediction in esophageal cancer using radiomics and body composition from pretreatment and follow-up T12-level computed tomography. World J Gastrointest Oncol 2025; 17(12): 112873
- URL: https://www.wjgnet.com/1948-5204/full/v17/i12/112873.htm
- DOI: https://dx.doi.org/10.4251/wjgo.v17.i12.112873