
















©The Author(s) 2025.
World J Gastrointest Oncol. Dec 15, 2025; 17(12): 112853
Published online Dec 15, 2025. doi: 10.4251/wjgo.v17.i12.112853
Published online Dec 15, 2025. doi: 10.4251/wjgo.v17.i12.112853
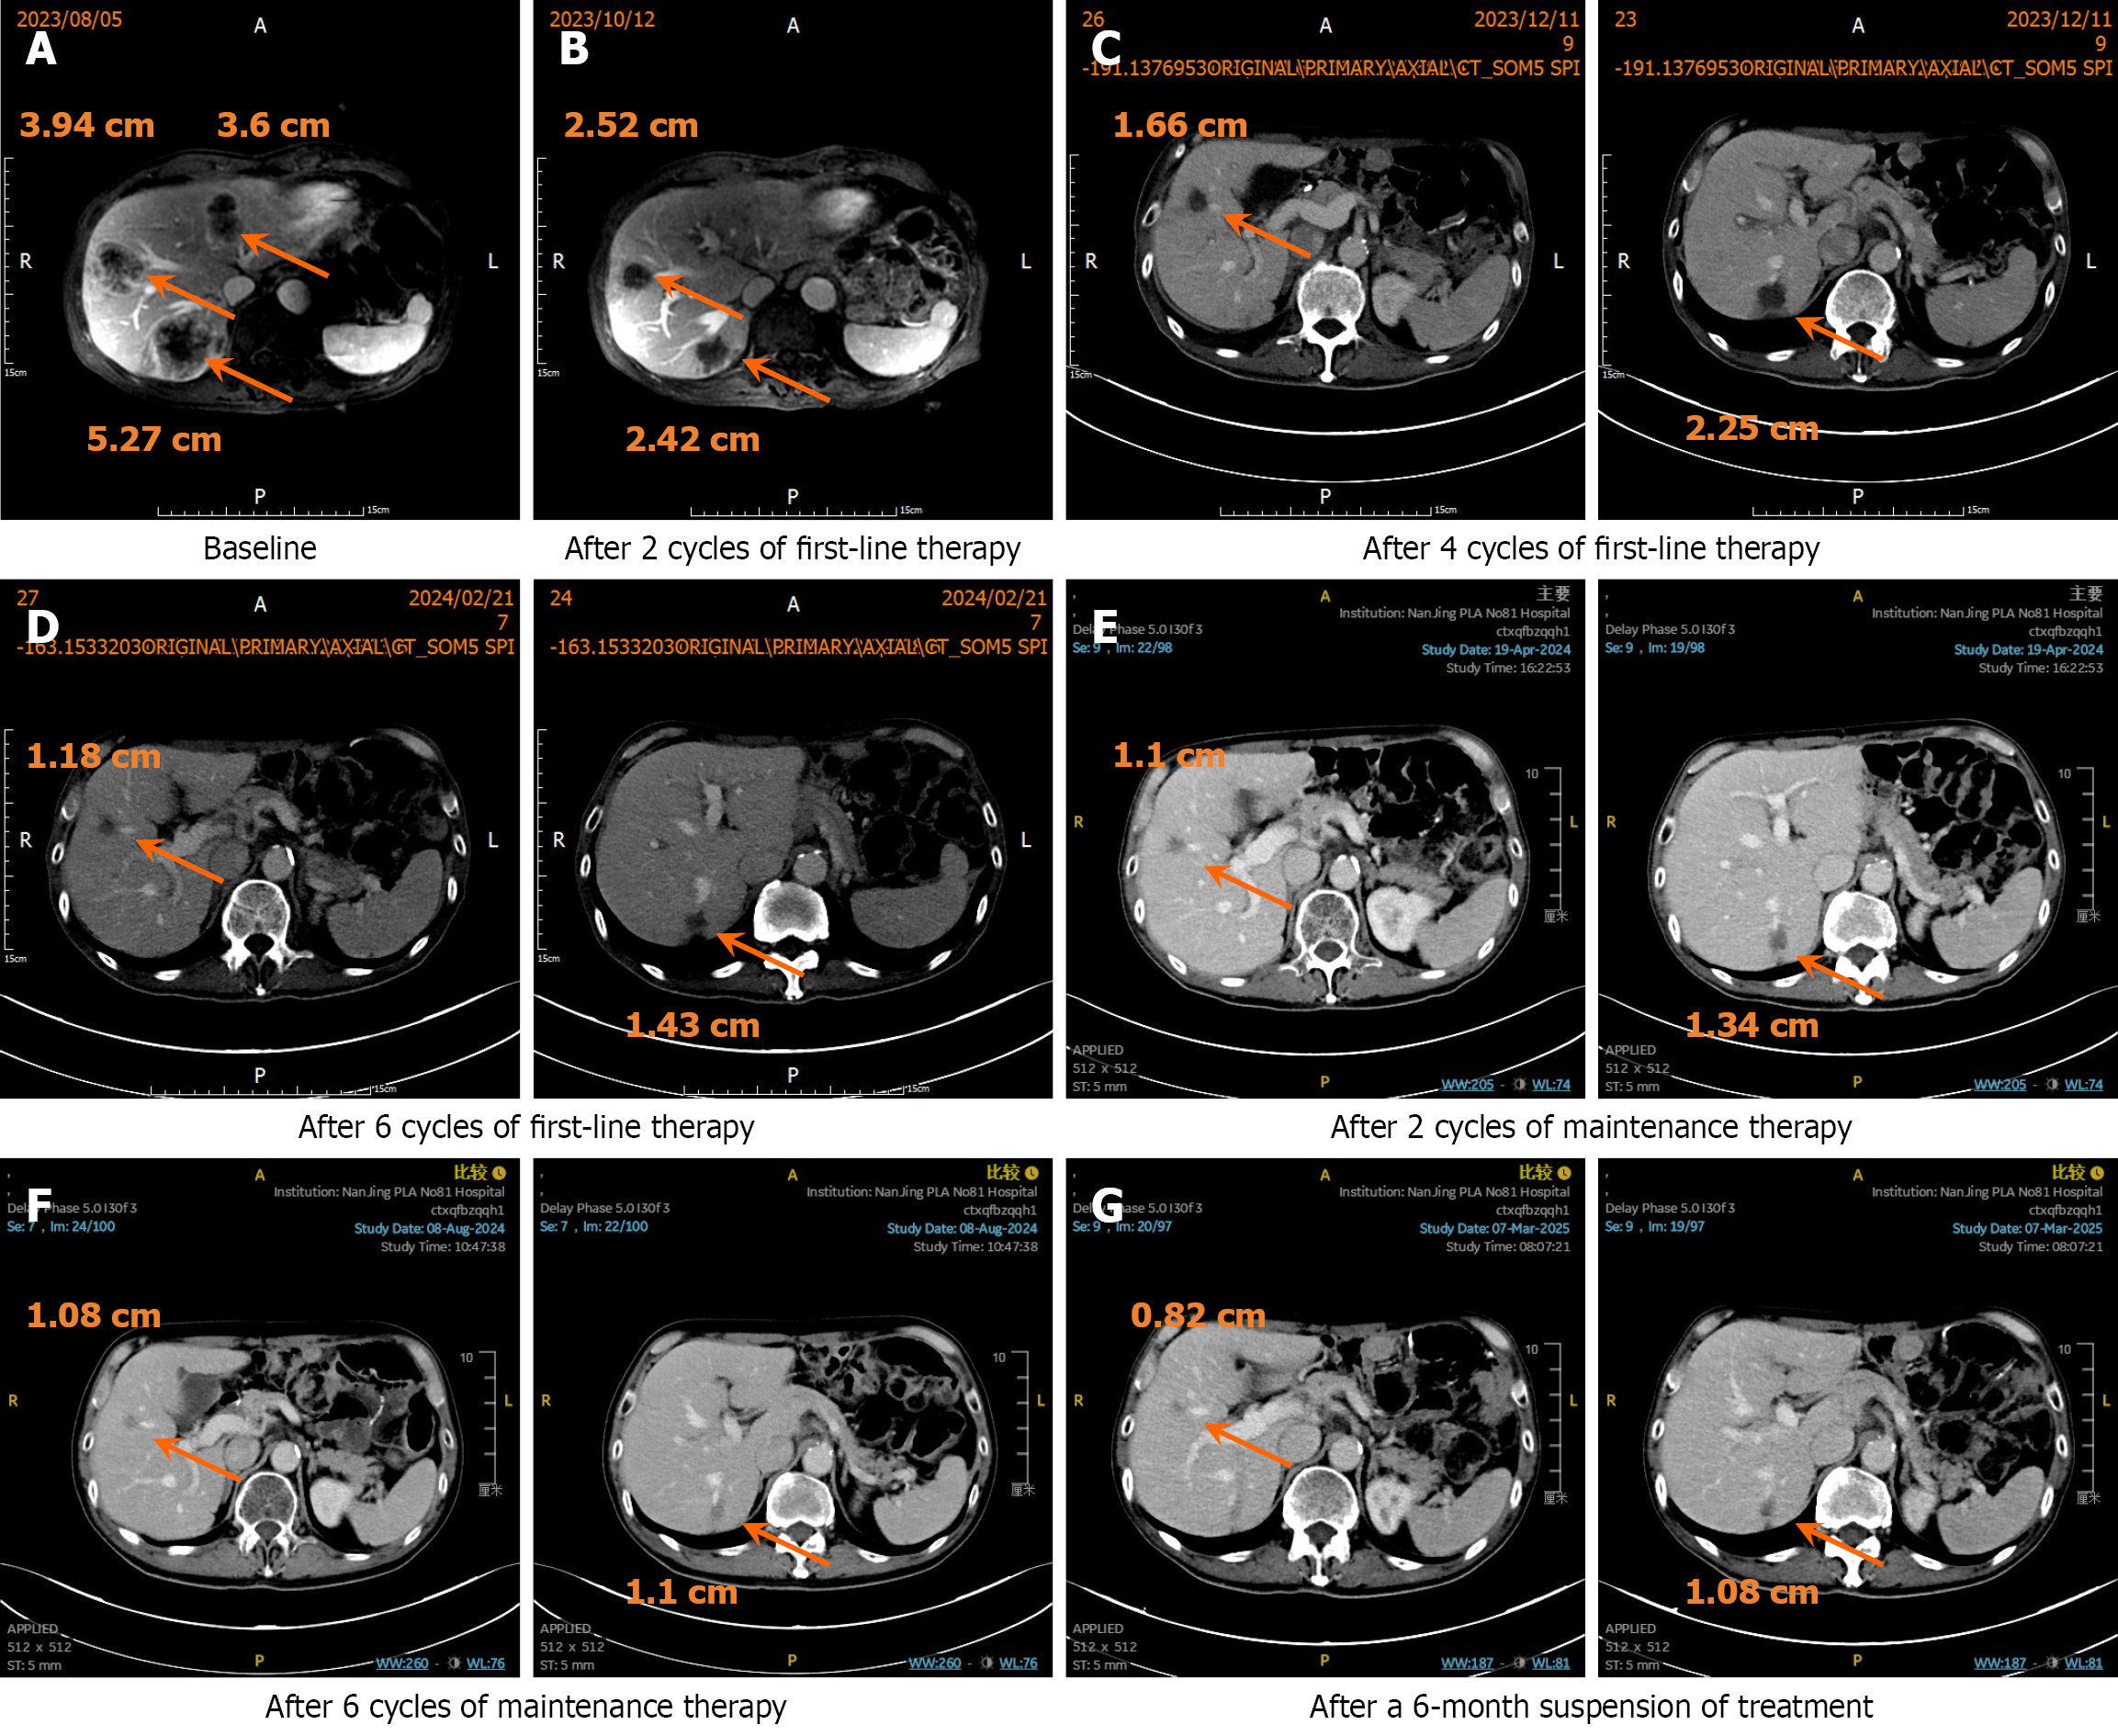
Figure 2 Abdominal computed tomography and magnetic resonance during the treatment and follow-up.
A: Magnetic resonance imaging done at the baseline before starting the therapy showed three liver lesions, with the largest measuring 527 cm; B: Magnetic resonance imaging performed after 2 cycles of first-line therapy showed a significant reduction in the liver lesions; C: Contrast-enhanced computed tomography (CT) done after 4 cycles of first-line therapy; D: Contrast-enhanced CT after 6 cycles of first-line therapy; E: Contrast-enhanced CT after 2 cycles of maintenance treatment; F: Contrast-enhanced CT done on August 8, 2024, after 6 cycles of maintenance treatment, showing sustained partial response; G: Contrast-enhanced CT done on March 7, 2025, after 6 months of treatment interruption. Oranges arrows indicate the primary lesions.
- Citation: Pan J, Li P, Zhou YH, Pan TT, Chen YT, Chu XY. Long-term survival after treatment of gastric cancer with S-1 plus oxaliplatin regimen and sintilimab: A case report. World J Gastrointest Oncol 2025; 17(12): 112853
- URL: https://www.wjgnet.com/1948-5204/full/v17/i12/112853.htm
- DOI: https://dx.doi.org/10.4251/wjgo.v17.i12.112853