
















©The Author(s) 2025.
World J Gastrointest Oncol. Dec 15, 2025; 17(12): 110736
Published online Dec 15, 2025. doi: 10.4251/wjgo.v17.i12.110736
Published online Dec 15, 2025. doi: 10.4251/wjgo.v17.i12.110736
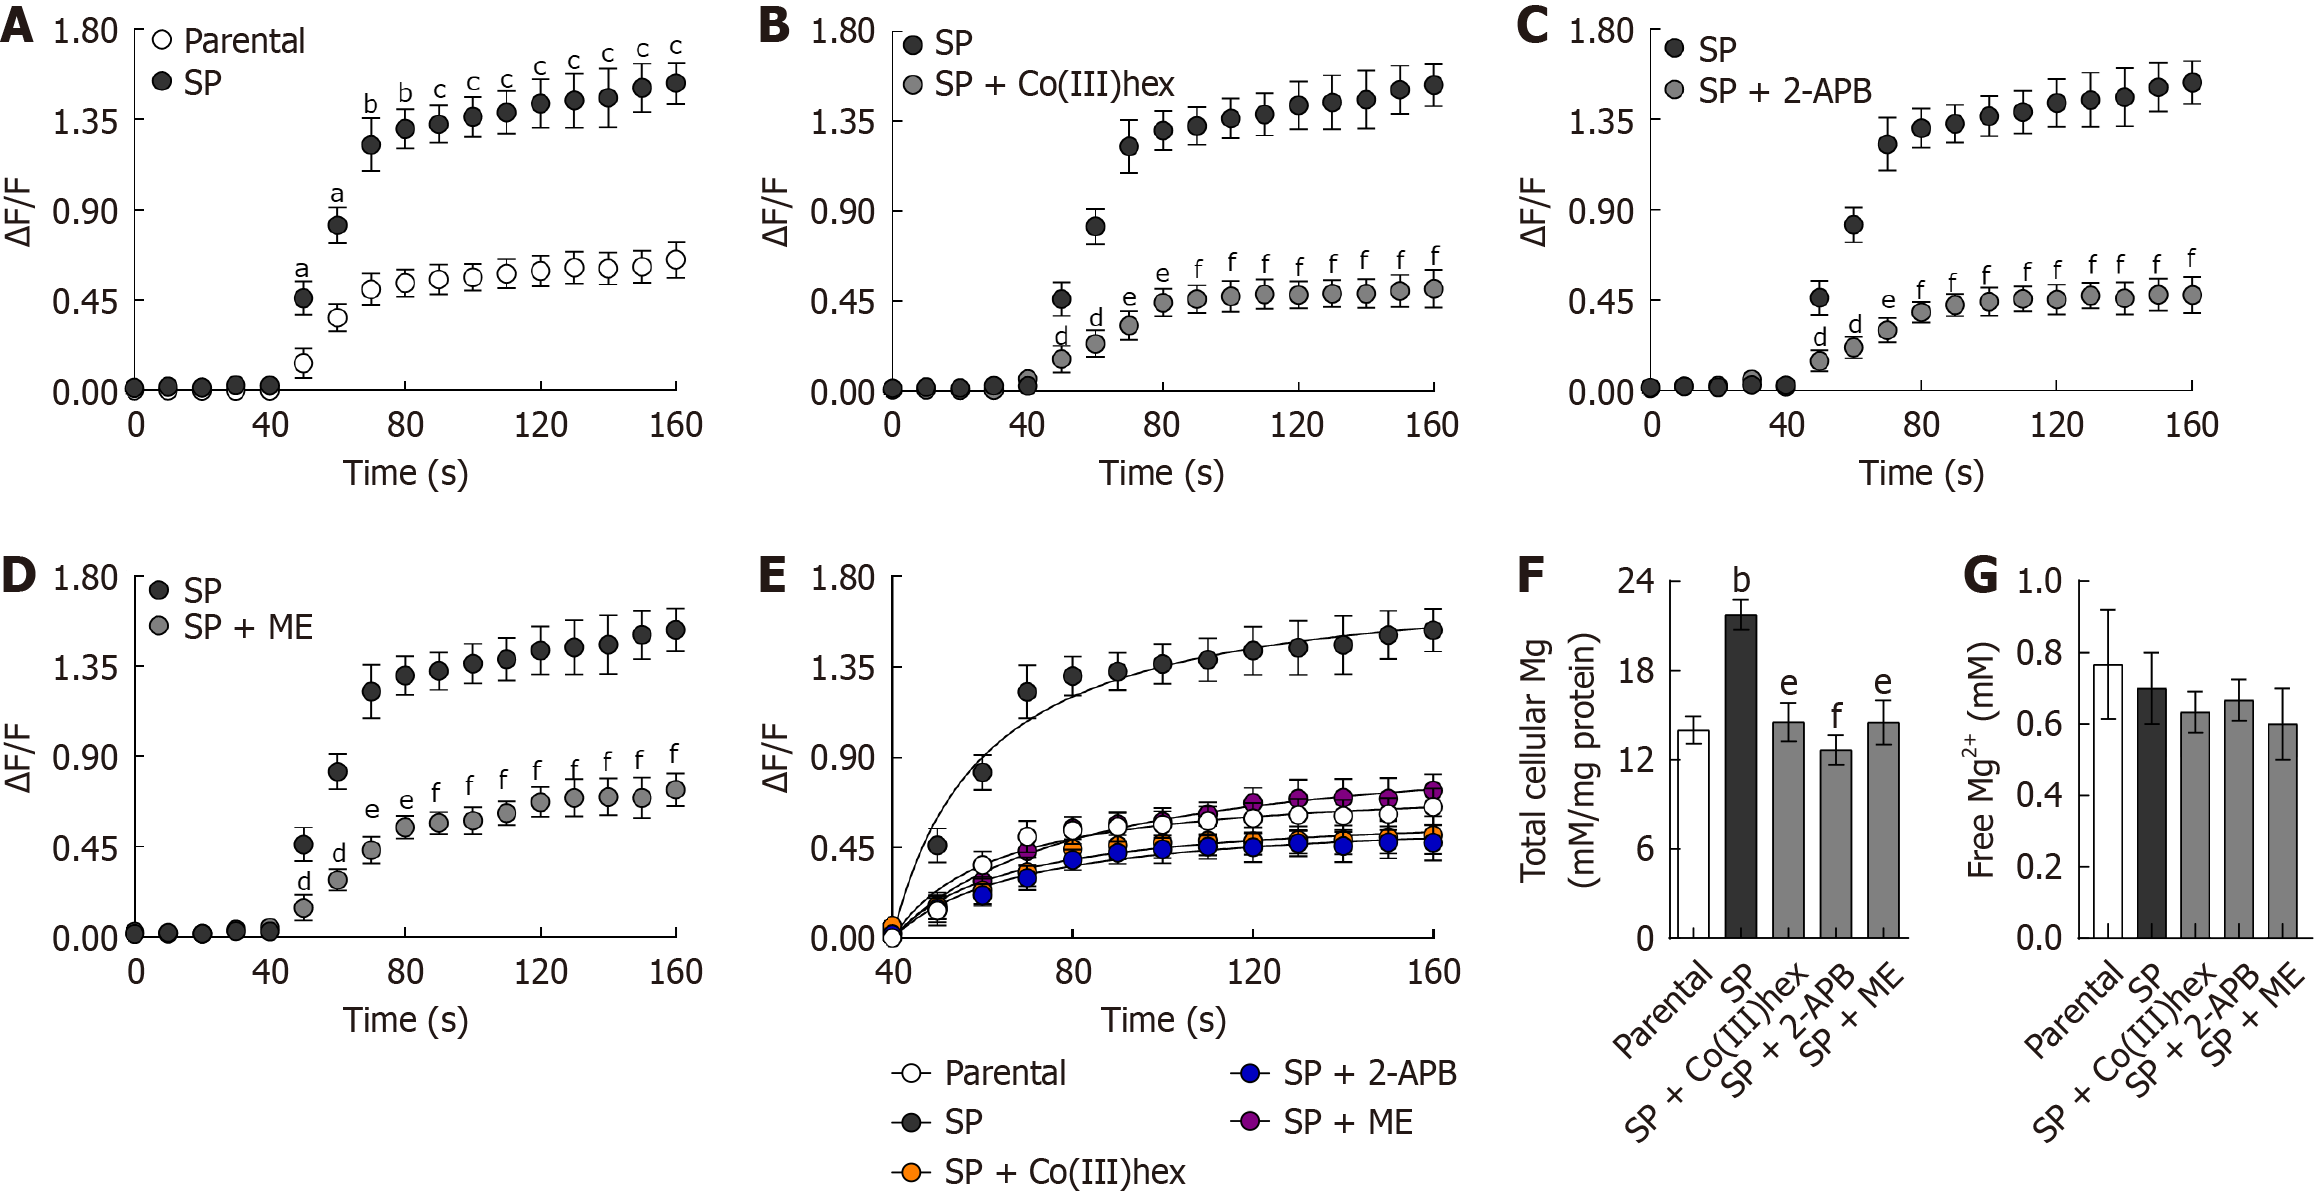
Figure 2 Mg2+ influx and total Mg content in cancer spheroids.
A: Mg2+ influx in parental HT-29 cells compared with spheroid (SP)-derived HT-29 cells; B: Mg2+ influx in SP cells with or without the Mg2+ channel inhibitor Co(III)hexamine; C: Mg2+ influx in SP cells with or without the transient receptor potential melastatin 6/7 inhibitor 2-aminoethyl diphenylborinate; D: Mg2+ influx in SP cells with or without the transient receptor potential melastatin 6 inhibitor Mesendogen; E: Michaelis-Menten kinetic analysis of ΔF/F values between 40 and 160 seconds in parental HT-29 vs SP cells, SP vs SP with Co(III)hexamine, SP vs SP with 2-aminoethyl diphenylborinate, and SP vs SP with Mesendogen; F: Total intracellular Mg2+ content; G: Free intracellular Mg2+ level. SP: Spheroid; Co(III)hex: Co(III)hexamine; 2-APB: 2-aminoethyl diphenylborinate; ME: Mesendogen. aP < 0.05 vs parental HT-29 cells, bP < 0.01 vs parental HT-29 cells, cP < 0.001 vs parental HT-29 cells, dP < 0.05 vs spheroid group, eP < 0.01 vs spheroid group, and fP < 0.001 vs spheroid group.
- Citation: Kampuang N, Chamniansawat S, Pongkorpsakol P, Treveeravoot S, Thongon N. Transient receptor potential melastatin 6 and transient receptor potential melastatin 6/7 antagonists suppress colon adenocarcinoma HT-29 cells. World J Gastrointest Oncol 2025; 17(12): 110736
- URL: https://www.wjgnet.com/1948-5204/full/v17/i12/110736.htm
- DOI: https://dx.doi.org/10.4251/wjgo.v17.i12.110736