
















©The Author(s) 2025.
World J Gastrointest Oncol. Nov 15, 2025; 17(11): 112981
Published online Nov 15, 2025. doi: 10.4251/wjgo.v17.i11.112981
Published online Nov 15, 2025. doi: 10.4251/wjgo.v17.i11.112981
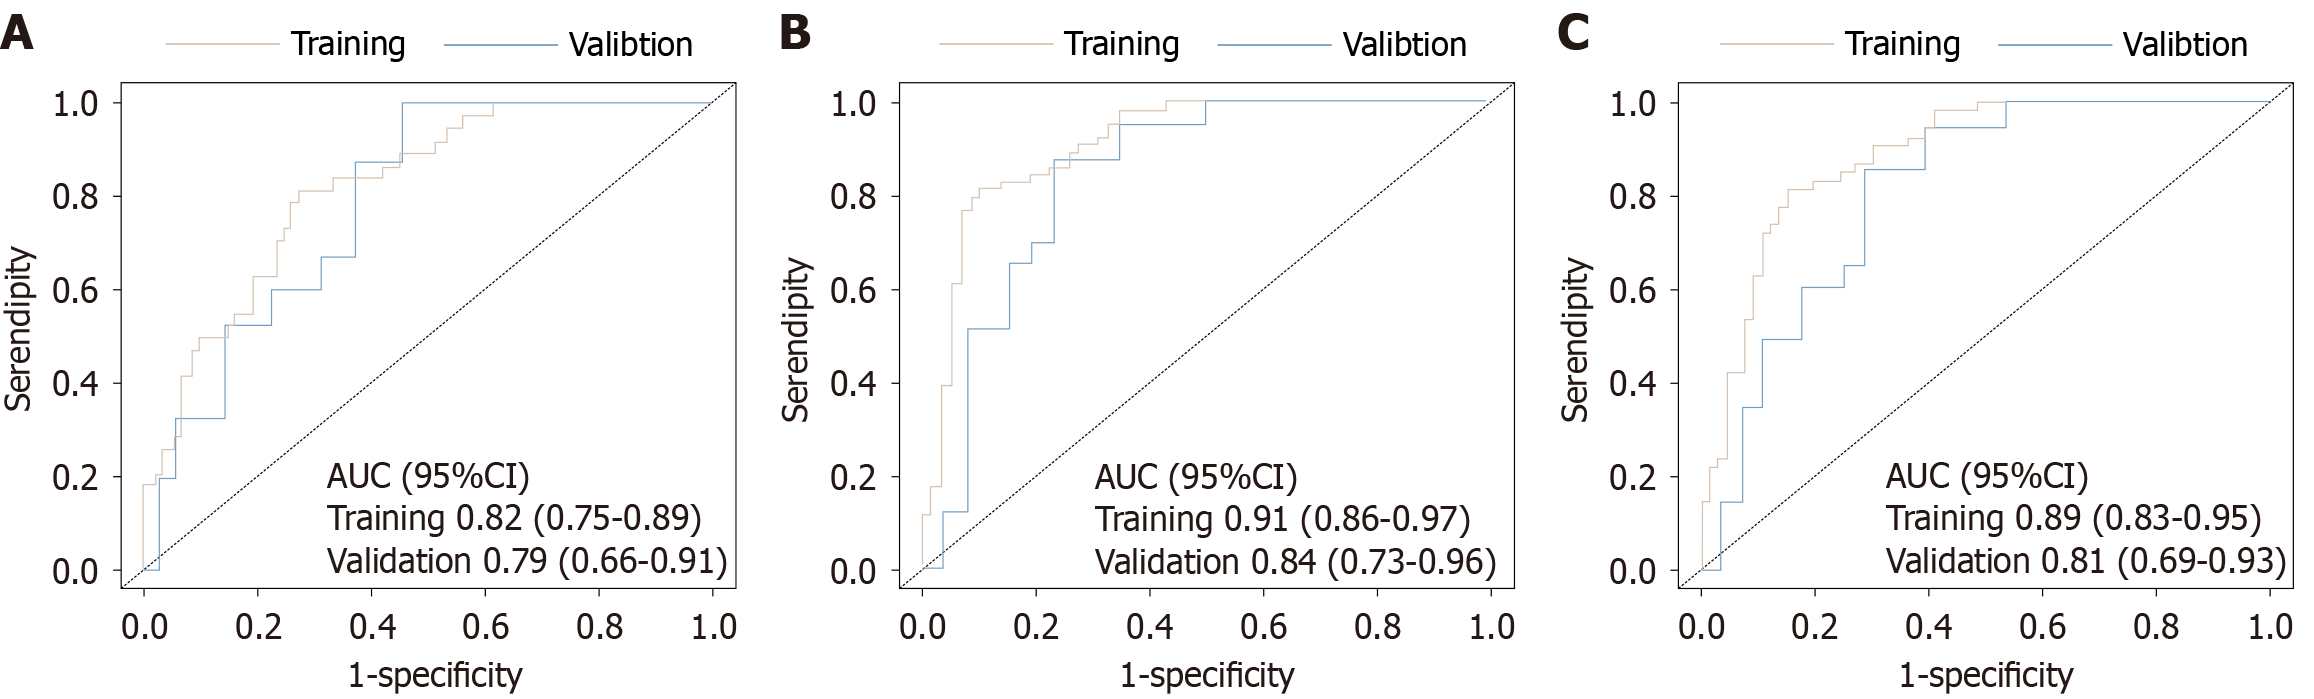
Figure 4 The evaluation of the nomogram for predicting overall survival.
A: Graph showing the training set and validation set receiver operating characteristic (ROC) evaluation plots for 12-month prognostic prediction model; B: Graph showing the training set and validation set ROC evaluation plots for 15-month prognostic prediction model; C: Graph showing the training set and validation set ROC evaluation plots for 18-month prognostic prediction model. AUC: Area under the curve; CI: Confidence interval.
- Citation: Yao ZY, Bao G, Li GC, Hao QL, Ma LJ, Rao YX, Xu K, Ma X, Han ZX. Survival prognosis in advanced HER-2 negative gastric cancer treated with immunochemotherapy: A novel model. World J Gastrointest Oncol 2025; 17(11): 112981
- URL: https://www.wjgnet.com/1948-5204/full/v17/i11/112981.htm
- DOI: https://dx.doi.org/10.4251/wjgo.v17.i11.112981