
















©The Author(s) 2025.
World J Gastrointest Oncol. Nov 15, 2025; 17(11): 110828
Published online Nov 15, 2025. doi: 10.4251/wjgo.v17.i11.110828
Published online Nov 15, 2025. doi: 10.4251/wjgo.v17.i11.110828
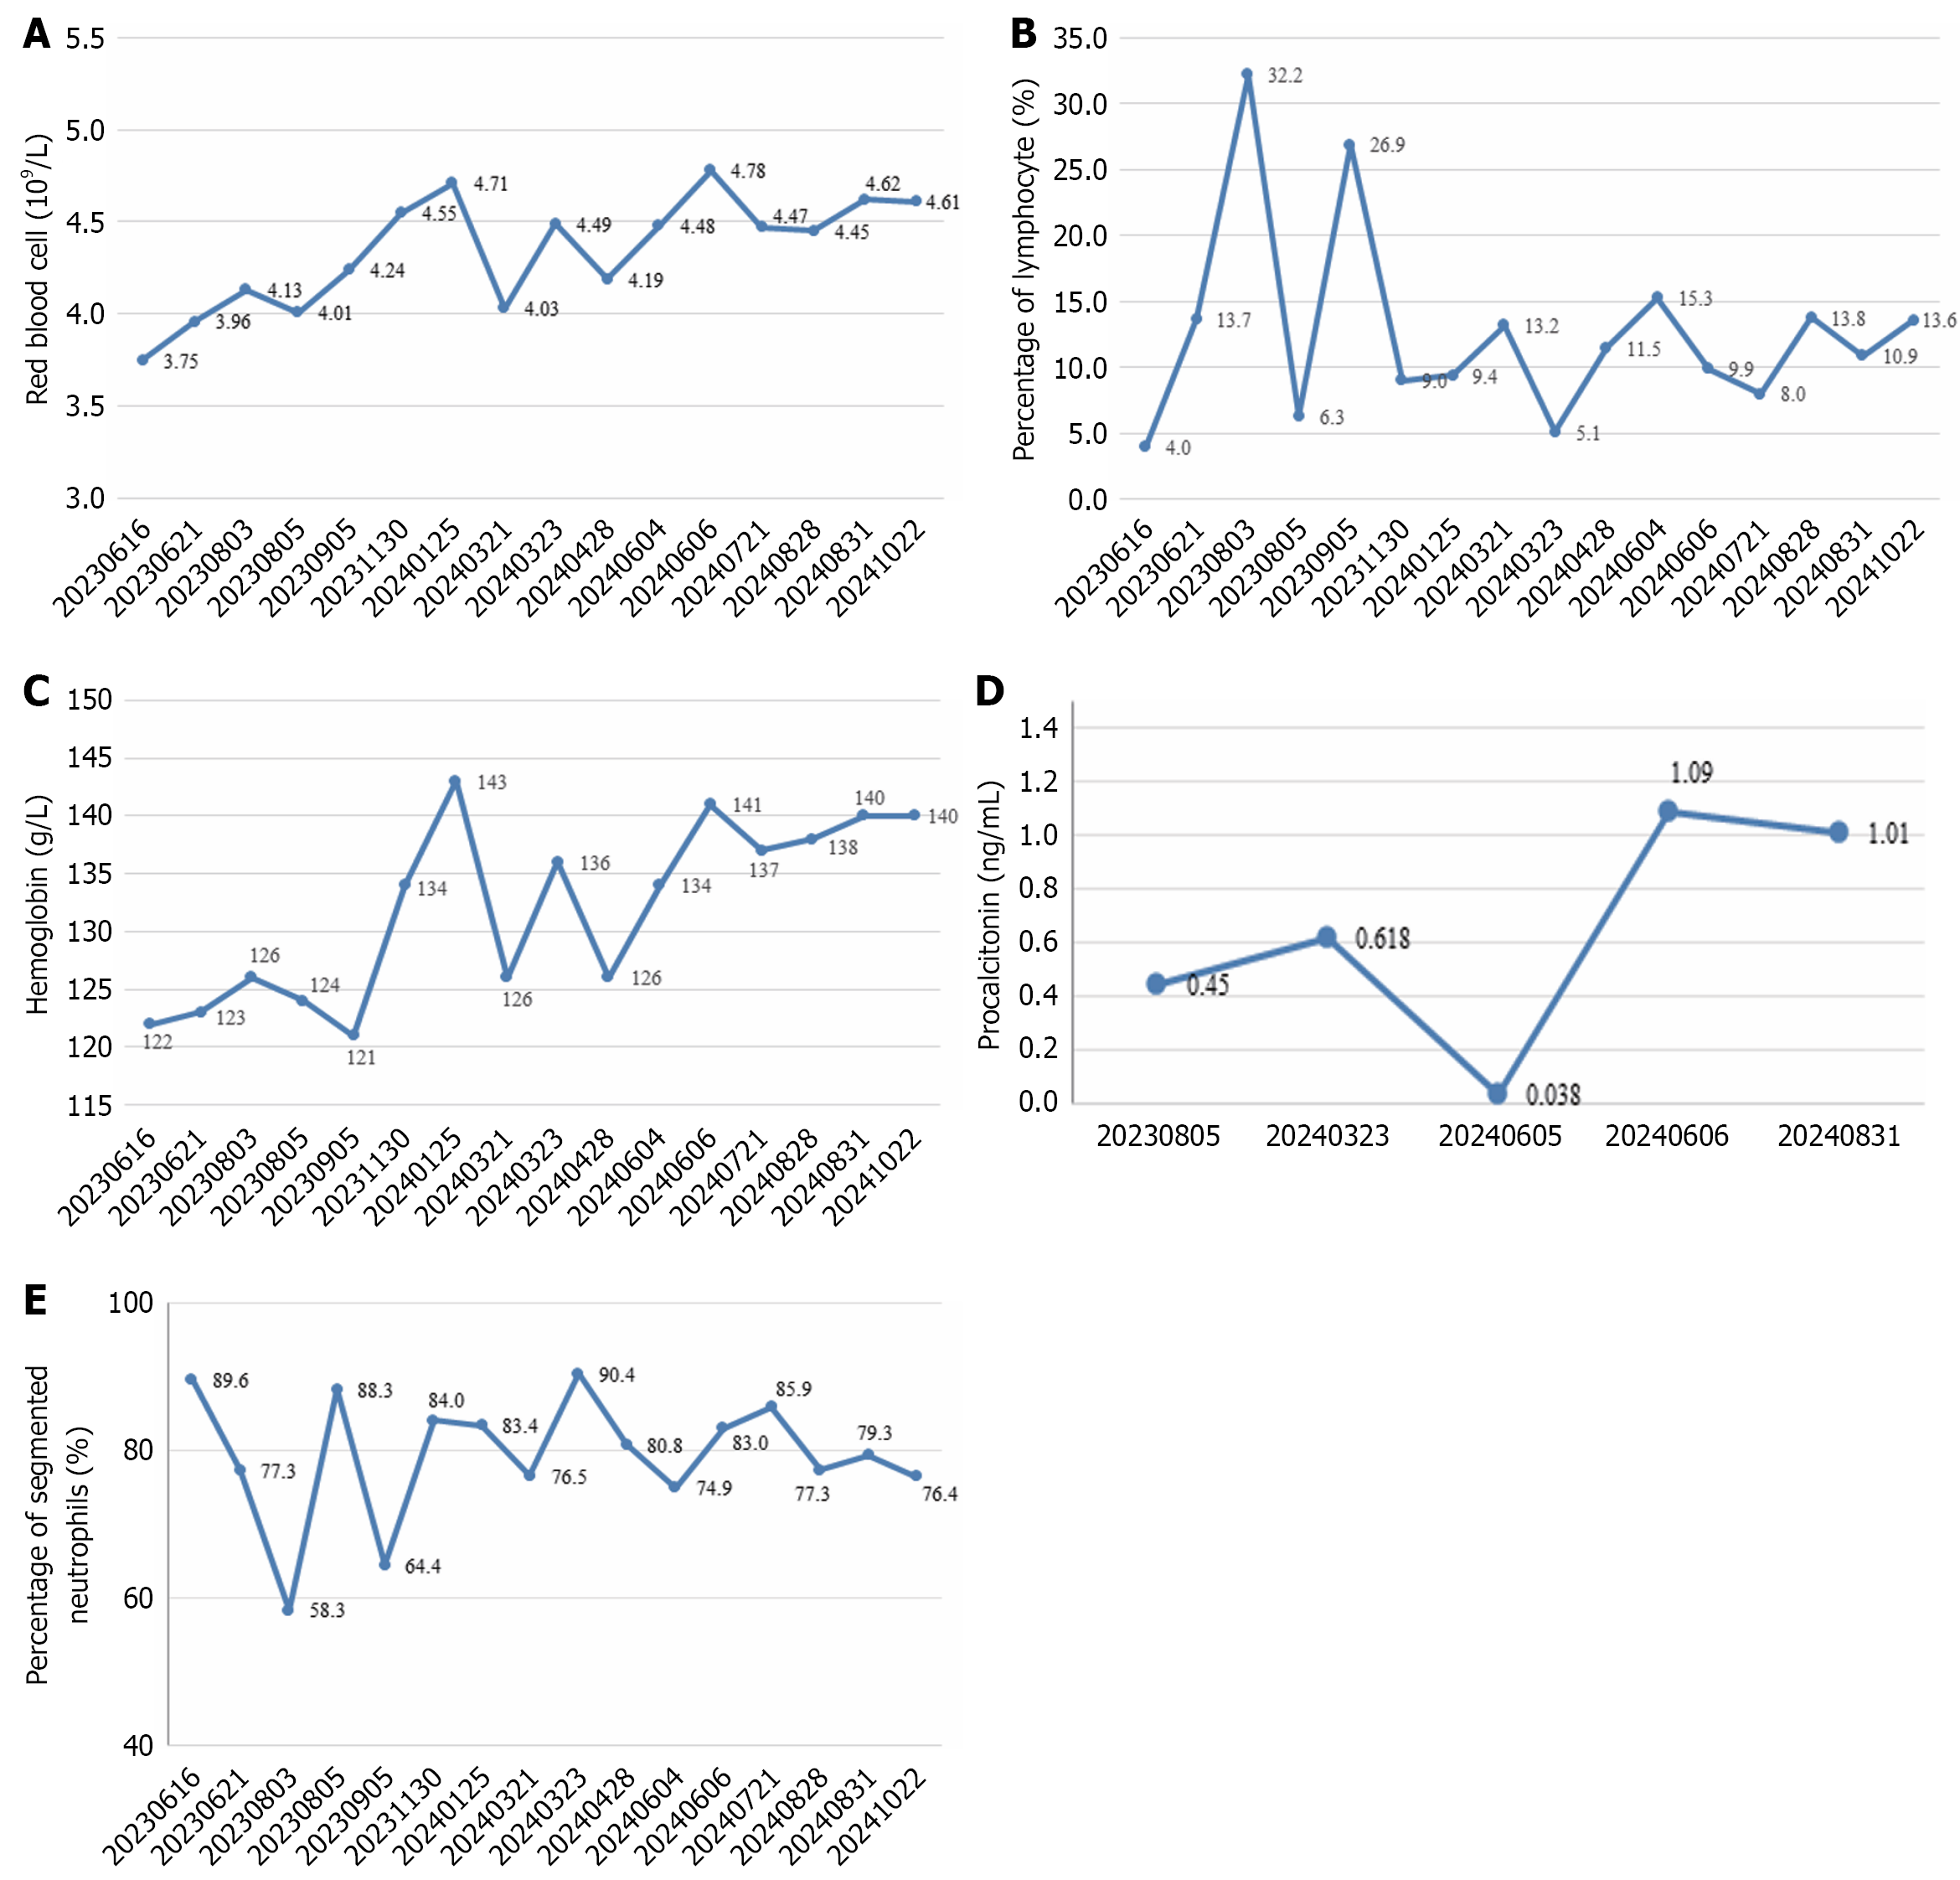
Figure 1 Line graph of core hematological parameters in blood examinations.
A: Line graph of red blood cell changes; B: Line graph of lymphocyte percentage changes; C: Line graph of hemoglobin changes; D: Line graph of procalcitonin changes; E: Line graph of segmented neutrophil percentage changes.
- Citation: Yang SH, Ren HF, Chen X, Wang R, Zhang MG. Refractory esophageal stenosis after endoscopic submucosal dissection for esophageal cancer managed with multiple dilations: A case report. World J Gastrointest Oncol 2025; 17(11): 110828
- URL: https://www.wjgnet.com/1948-5204/full/v17/i11/110828.htm
- DOI: https://dx.doi.org/10.4251/wjgo.v17.i11.110828