
















©The Author(s) 2025.
World J Gastrointest Oncol. Oct 15, 2025; 17(10): 111509
Published online Oct 15, 2025. doi: 10.4251/wjgo.v17.i10.111509
Published online Oct 15, 2025. doi: 10.4251/wjgo.v17.i10.111509
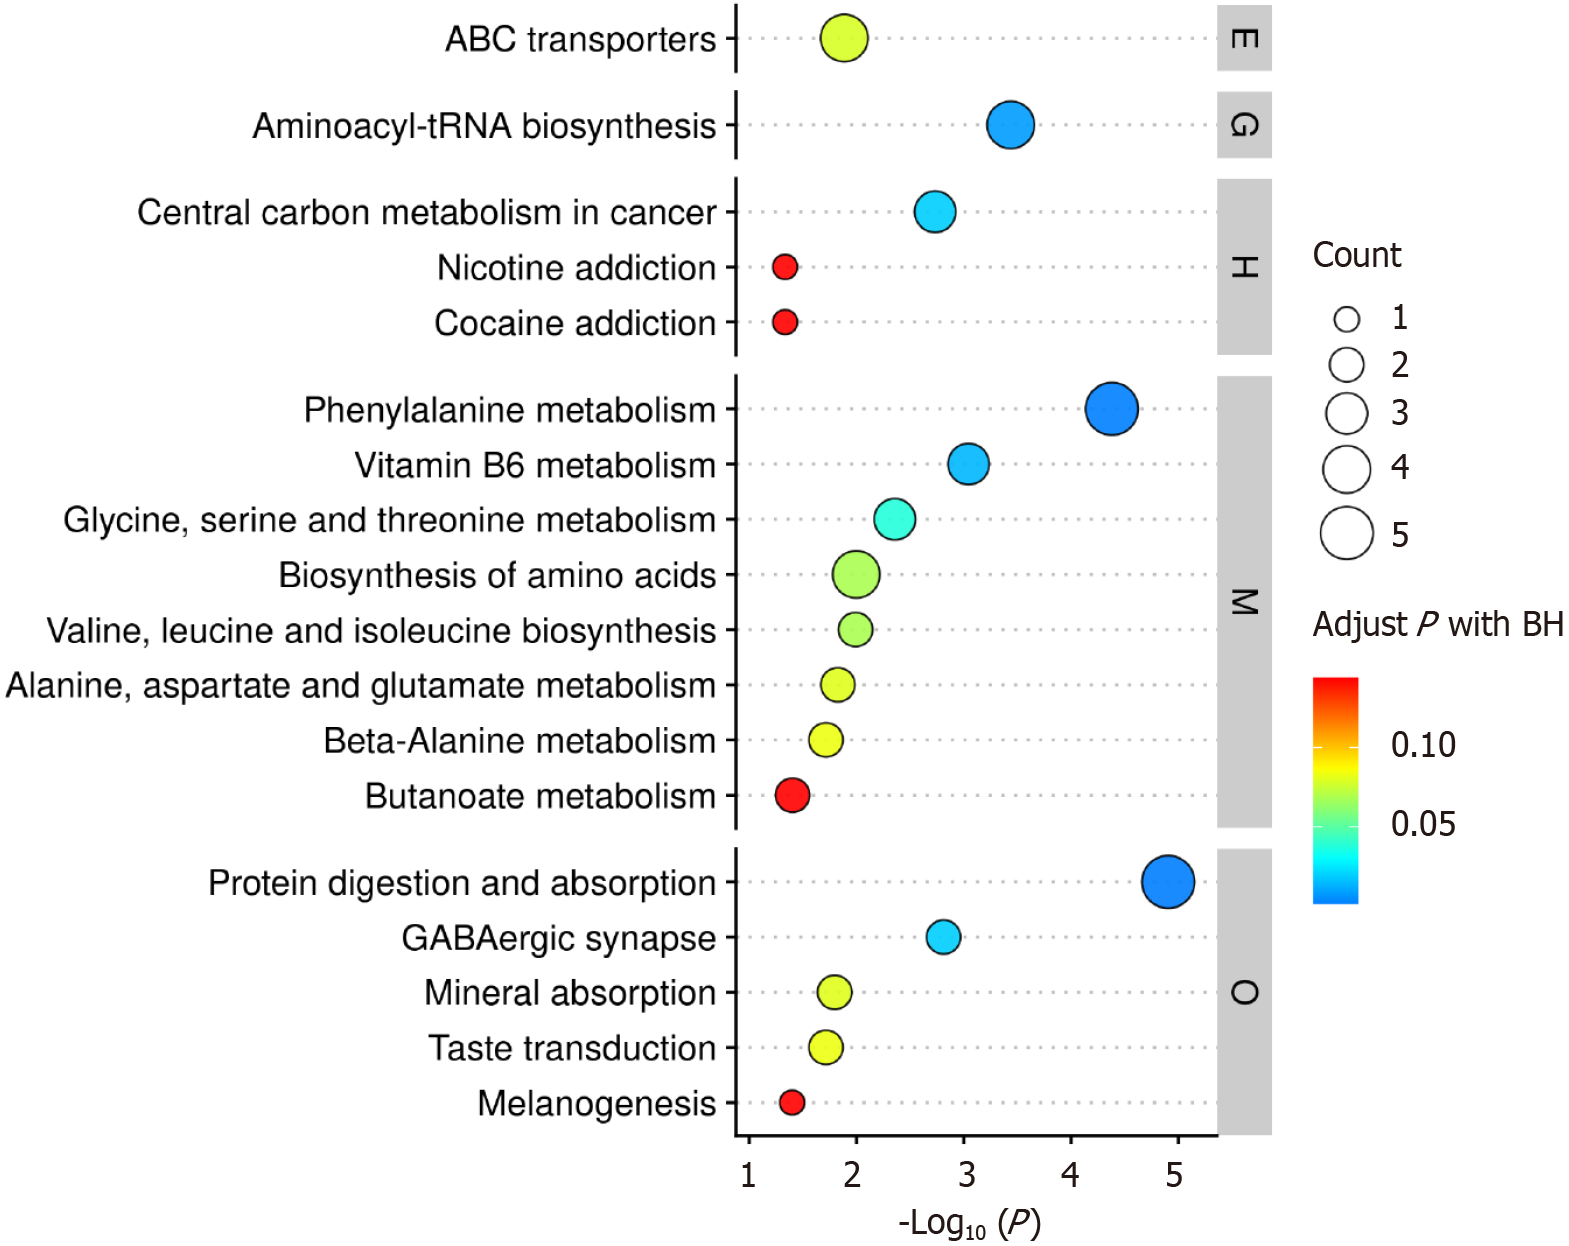
Figure 14 Top 30 significantly enriched pathways of differential metabolites.
The X-axis represents the negative logarithmic transformation of the P value, and the Y-axis displays the pathway names. The pathways are categorized into level 1 classifications, with pathways in each category arranged from top to bottom in descending order of significance [i.e., -log10 (P value) decreases, meaning the P value increases and significance declines]. The size of the circles corresponds to the count (number of differential metabolites annotated to the pathway); the color gradient (red to blue) reflects the adjusted P value, with red indicating higher significance. ABC: Adenosine triphosphate-binding cassette; BH: Benjamini-Hochberg method; E: Environmental information processing; G: Genetic information processing; H: Human diseases; M: Metabolism; O: Organismal systems.
- Citation: Deng P, Lin H, Zeng H, Guo F. Gut microbiota and metabolite changes in metastatic colorectal cancer via 16S rRNA and metabolomics. World J Gastrointest Oncol 2025; 17(10): 111509
- URL: https://www.wjgnet.com/1948-5204/full/v17/i10/111509.htm
- DOI: https://dx.doi.org/10.4251/wjgo.v17.i10.111509