
















©The Author(s) 2025.
World J Gastrointest Oncol. Oct 15, 2025; 17(10): 111509
Published online Oct 15, 2025. doi: 10.4251/wjgo.v17.i10.111509
Published online Oct 15, 2025. doi: 10.4251/wjgo.v17.i10.111509
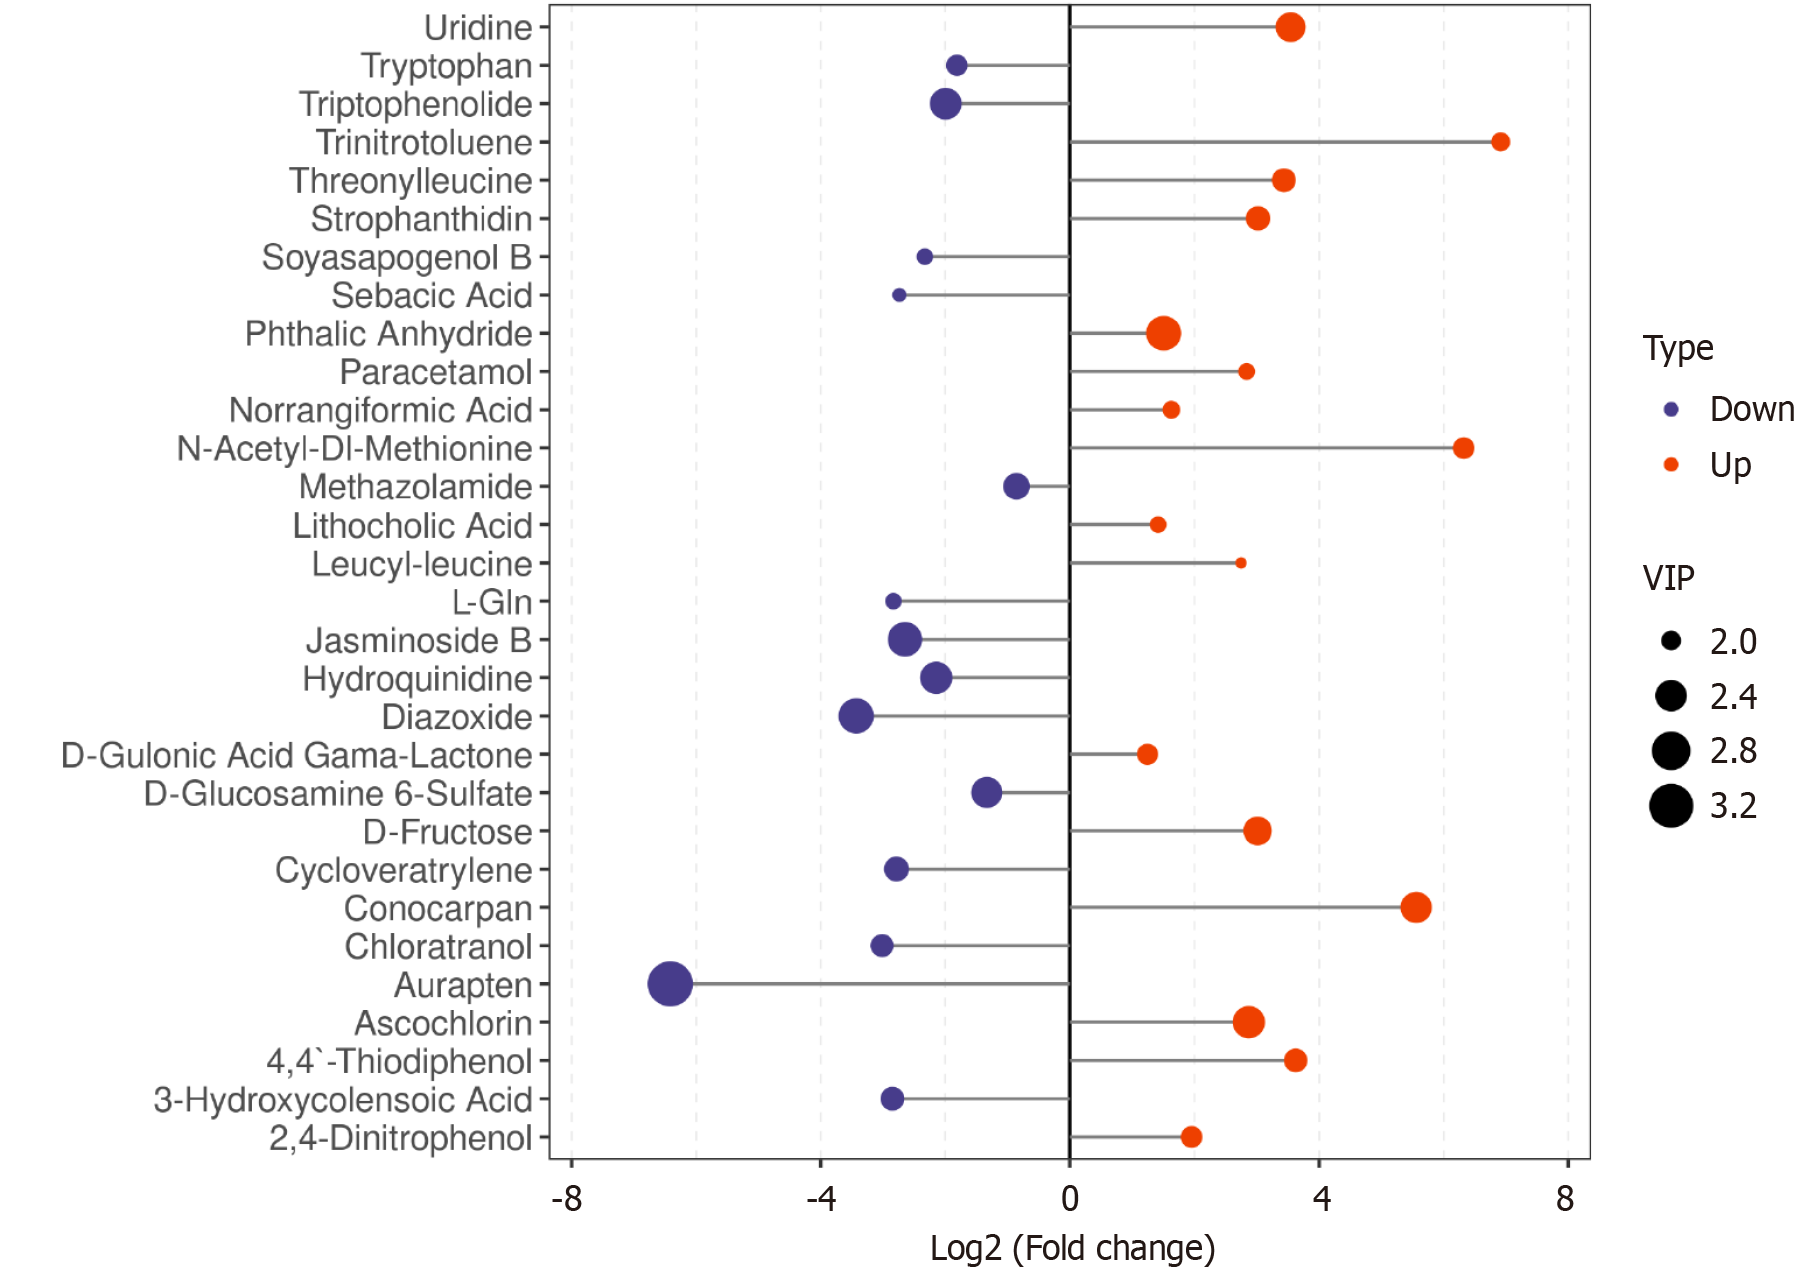
Figure 11 Bar plot of significant differential metabolites between groups in mixed ion mode.
The X-axis represents log2-transformed fold change values, while the Y-axis displays metabolite names. Blue and red data points on the left and right sides indicate downregulated and upregulated metabolites, respectively. The point size corresponds to the variable importance in projection (VIP) score, with larger dots denoting higher VIP values and thus greater metabolic significance. VIP: Variable importance in projection.
- Citation: Deng P, Lin H, Zeng H, Guo F. Gut microbiota and metabolite changes in metastatic colorectal cancer via 16S rRNA and metabolomics. World J Gastrointest Oncol 2025; 17(10): 111509
- URL: https://www.wjgnet.com/1948-5204/full/v17/i10/111509.htm
- DOI: https://dx.doi.org/10.4251/wjgo.v17.i10.111509