
















©The Author(s) 2025.
World J Gastrointest Oncol. Oct 15, 2025; 17(10): 111509
Published online Oct 15, 2025. doi: 10.4251/wjgo.v17.i10.111509
Published online Oct 15, 2025. doi: 10.4251/wjgo.v17.i10.111509
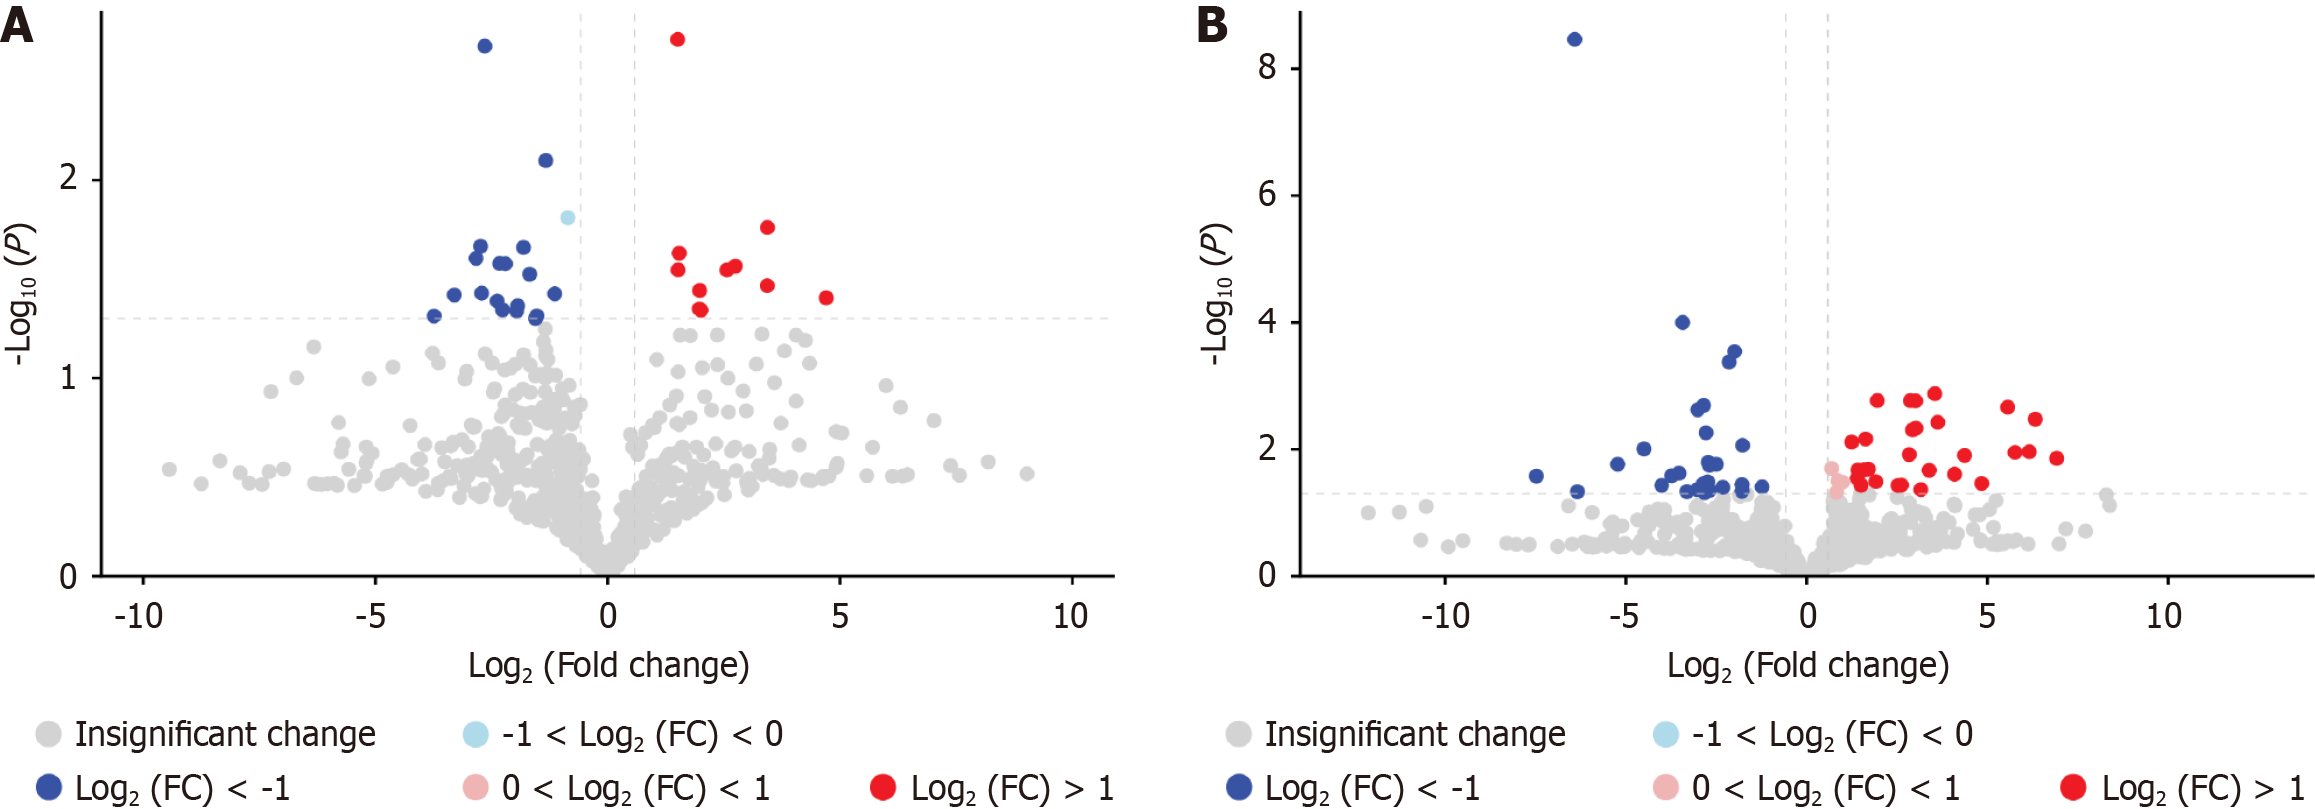
Figure 10 Volcano plot of differential metabolites.
A: In positive ionization mode; B: In negative ionization mode. The screening criteria were set as fold change (FC) > 1.5 or FC < 0.667 with a significance threshold of P < 0.05. Vertical dashed lines indicate log2 (1/1.5) and log2 (1.5). Red dots represent upregulated metabolites, while blue dots denote downregulated metabolites. FC: Fold change.
- Citation: Deng P, Lin H, Zeng H, Guo F. Gut microbiota and metabolite changes in metastatic colorectal cancer via 16S rRNA and metabolomics. World J Gastrointest Oncol 2025; 17(10): 111509
- URL: https://www.wjgnet.com/1948-5204/full/v17/i10/111509.htm
- DOI: https://dx.doi.org/10.4251/wjgo.v17.i10.111509