
















©The Author(s) 2025.
World J Gastrointest Oncol. Oct 15, 2025; 17(10): 111509
Published online Oct 15, 2025. doi: 10.4251/wjgo.v17.i10.111509
Published online Oct 15, 2025. doi: 10.4251/wjgo.v17.i10.111509
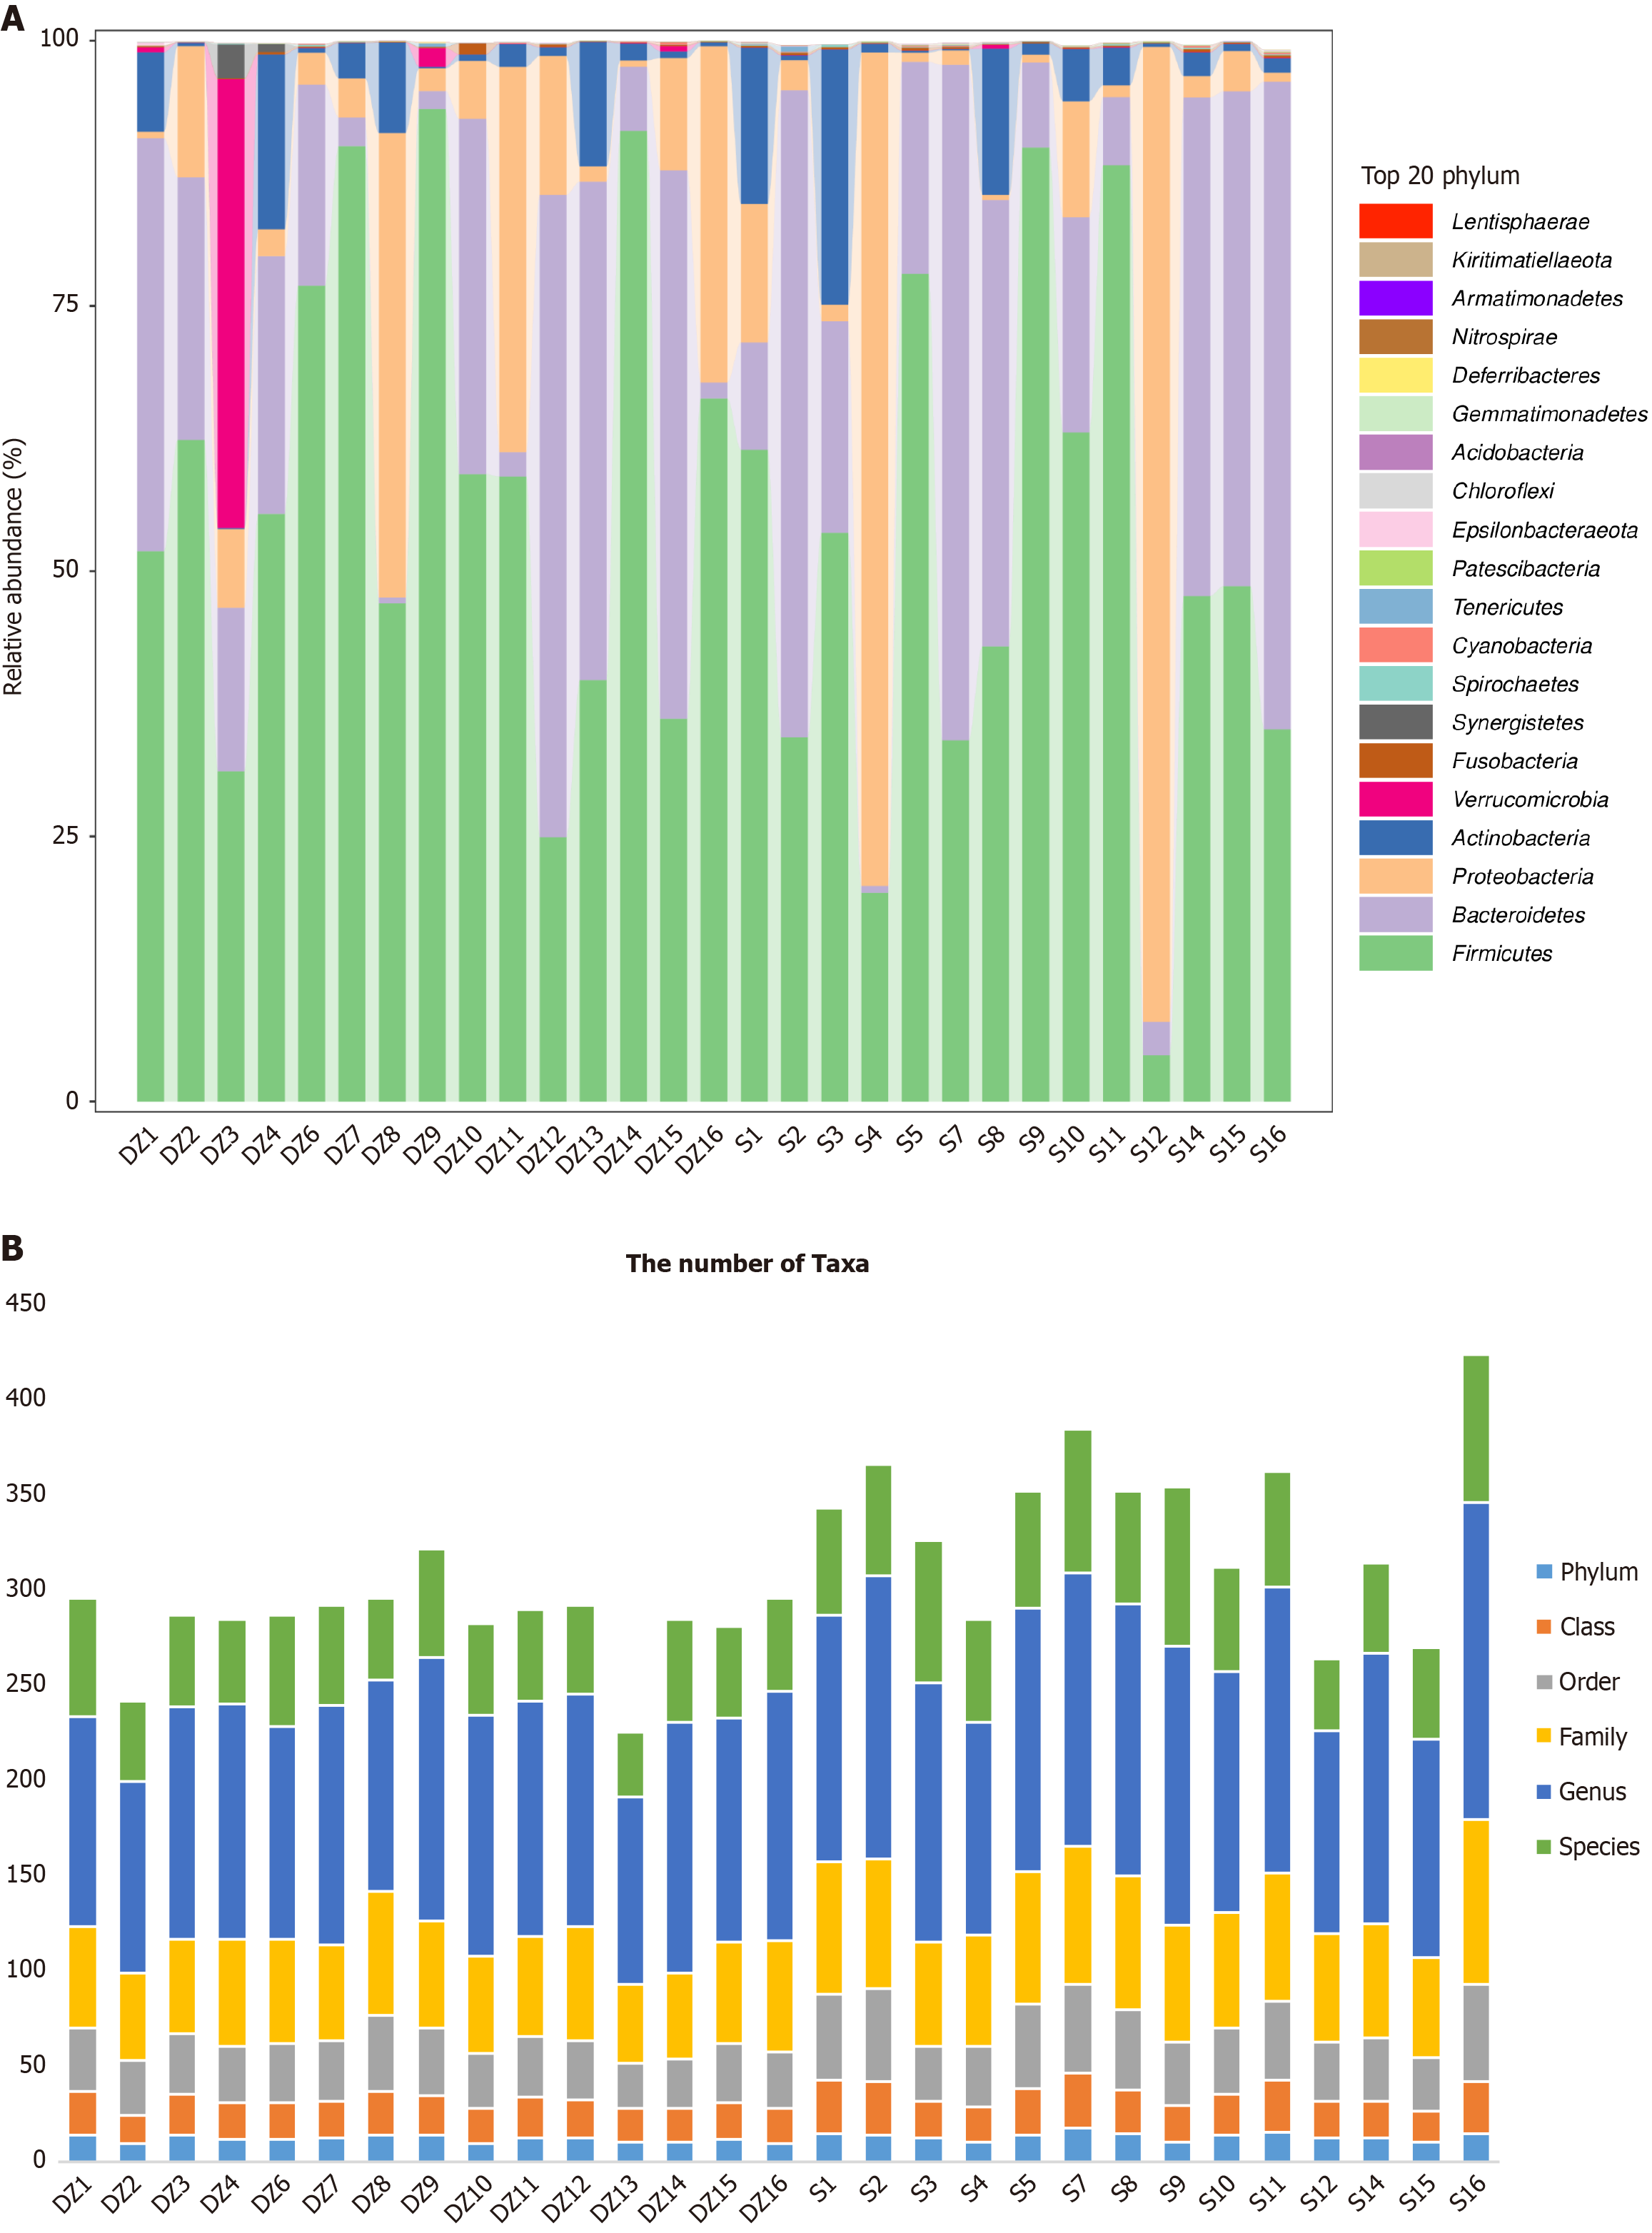
Figure 5 Gut microbiota analysis.
A: Compositional bar plot of gut microbiota at the phylum level between the two groups; B: Taxonomic unit counts of gut microbiota in the two groups. The X-axis displays sample names, while the Y-axis represents the number of taxonomic units at six levels: Phylum, class, order, family, genus, and species. S: Non-metastatic colorectal cancer patients; DZ: Distant metastatic colorectal cancer patients.
- Citation: Deng P, Lin H, Zeng H, Guo F. Gut microbiota and metabolite changes in metastatic colorectal cancer via 16S rRNA and metabolomics. World J Gastrointest Oncol 2025; 17(10): 111509
- URL: https://www.wjgnet.com/1948-5204/full/v17/i10/111509.htm
- DOI: https://dx.doi.org/10.4251/wjgo.v17.i10.111509