
















©The Author(s) 2025.
World J Gastrointest Oncol. Oct 15, 2025; 17(10): 111163
Published online Oct 15, 2025. doi: 10.4251/wjgo.v17.i10.111163
Published online Oct 15, 2025. doi: 10.4251/wjgo.v17.i10.111163
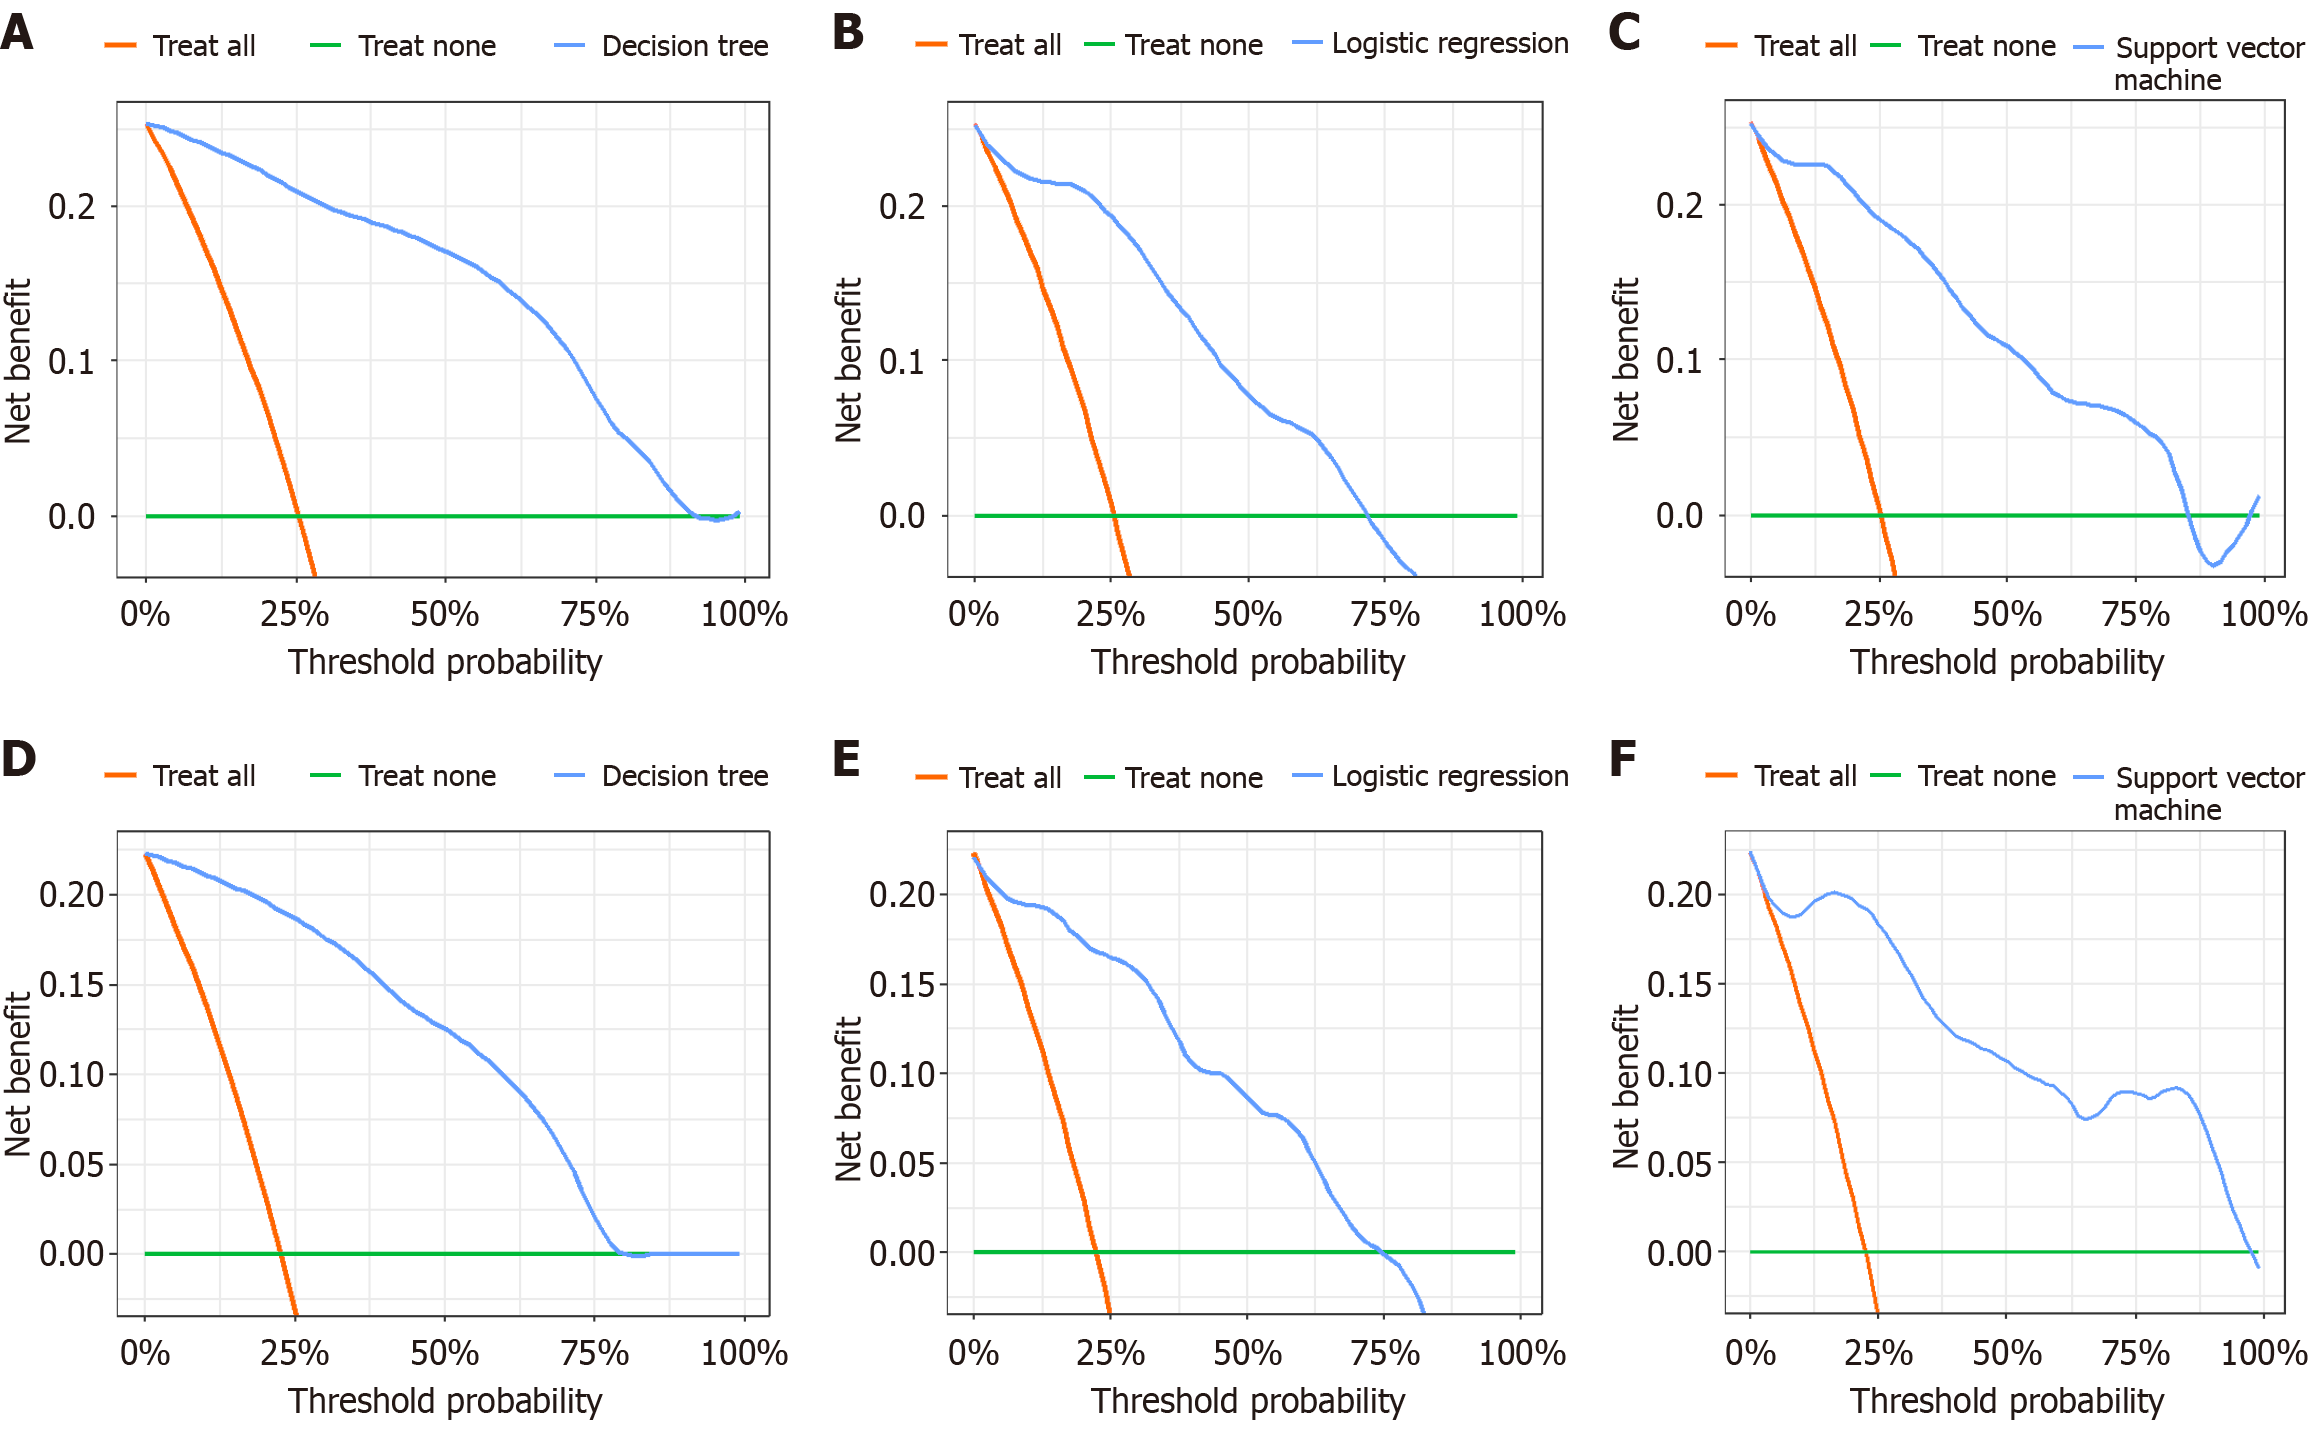
Figure 4 Decision curve of the three models.
A-C: In the training set: Decision tree (A); Logistic regression (B); Support vector machine (C). The X-axis shows the threshold probability. The Y-axis represents net benefit. “None” is the assumption that no patient developed delayed wound healing and “All” refers to the assumption that all patients developed delayed wound healing. When the threshold probability was 0%-89%, 0%-72% and 0%-85%, respectively, using the models to predict delayed wound healing adds a greater benefit; D-F: In the validation set: Decision tree (D); Logistic regression (E); Support vector machine (F). The X-axis shows the threshold probability. The Y-axis represents net benefit. “None” is the assumption that no patient developed delayed wound healing and “All” refers to the assumption that all patients developed delayed wound healing. When the threshold probability was 0%-77%, 0%-73% and 0%-95%, respectively, using the models to predict delayed wound healing adds a greater benefit.
- Citation: An Y, Sun YG, Feng S, Wang YS, Chen YY, Jiang J. Constructing a prediction model for delayed wound healing after gastric cancer radical surgery based on three machine learning algorithms. World J Gastrointest Oncol 2025; 17(10): 111163
- URL: https://www.wjgnet.com/1948-5204/full/v17/i10/111163.htm
- DOI: https://dx.doi.org/10.4251/wjgo.v17.i10.111163