
















©The Author(s) 2025.
World J Gastrointest Oncol. Oct 15, 2025; 17(10): 110671
Published online Oct 15, 2025. doi: 10.4251/wjgo.v17.i10.110671
Published online Oct 15, 2025. doi: 10.4251/wjgo.v17.i10.110671
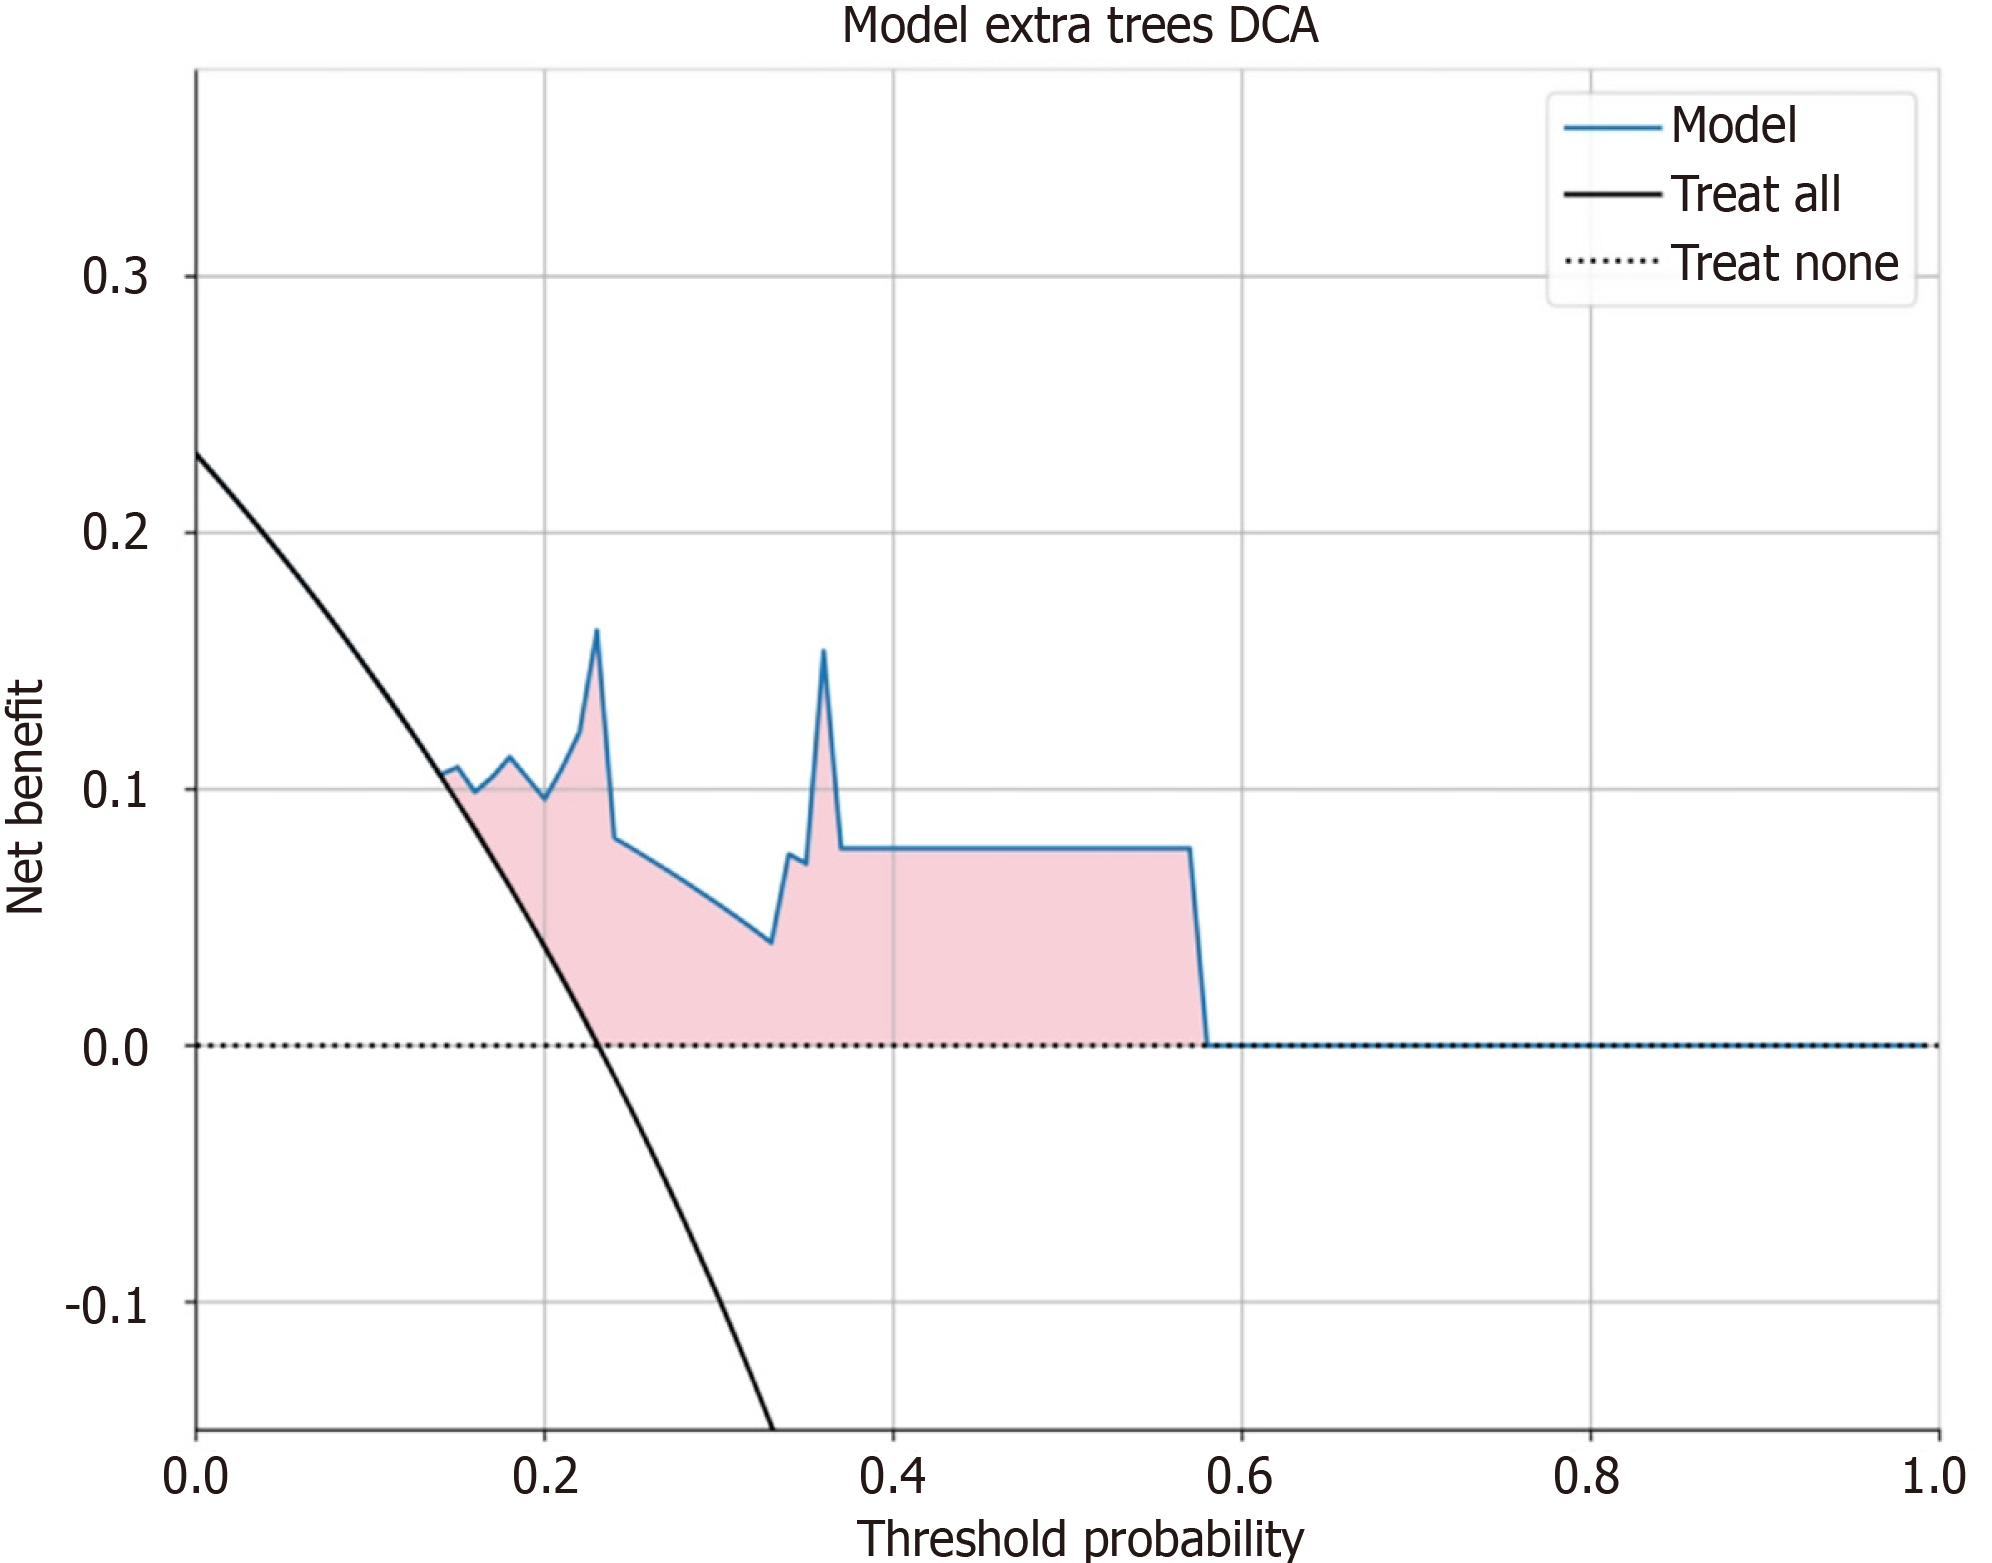
Figure 4 Decision curve analysis demonstrating clinical utility across probability thresholds in the validation cohort.
The Y-axis indicates net benefit standardized by patient population. The blue curve corresponds to the radiomics model, the black solid curve represents the all-patients-treated scenario, and the black dashed line indicates the no-patients-treated scenario. DCA: Decision curve analysis.
- Citation: Yang RH, Fan WX, Zhong Y, Lin ZP, Chen JP, Jiang GH, Dai HY. Predicting esophageal cancer response to neoadjuvant therapy with magnetic resonance imaging radiomics. World J Gastrointest Oncol 2025; 17(10): 110671
- URL: https://www.wjgnet.com/1948-5204/full/v17/i10/110671.htm
- DOI: https://dx.doi.org/10.4251/wjgo.v17.i10.110671