
















©The Author(s) 2025.
World J Gastrointest Oncol. Oct 15, 2025; 17(10): 109792
Published online Oct 15, 2025. doi: 10.4251/wjgo.v17.i10.109792
Published online Oct 15, 2025. doi: 10.4251/wjgo.v17.i10.109792
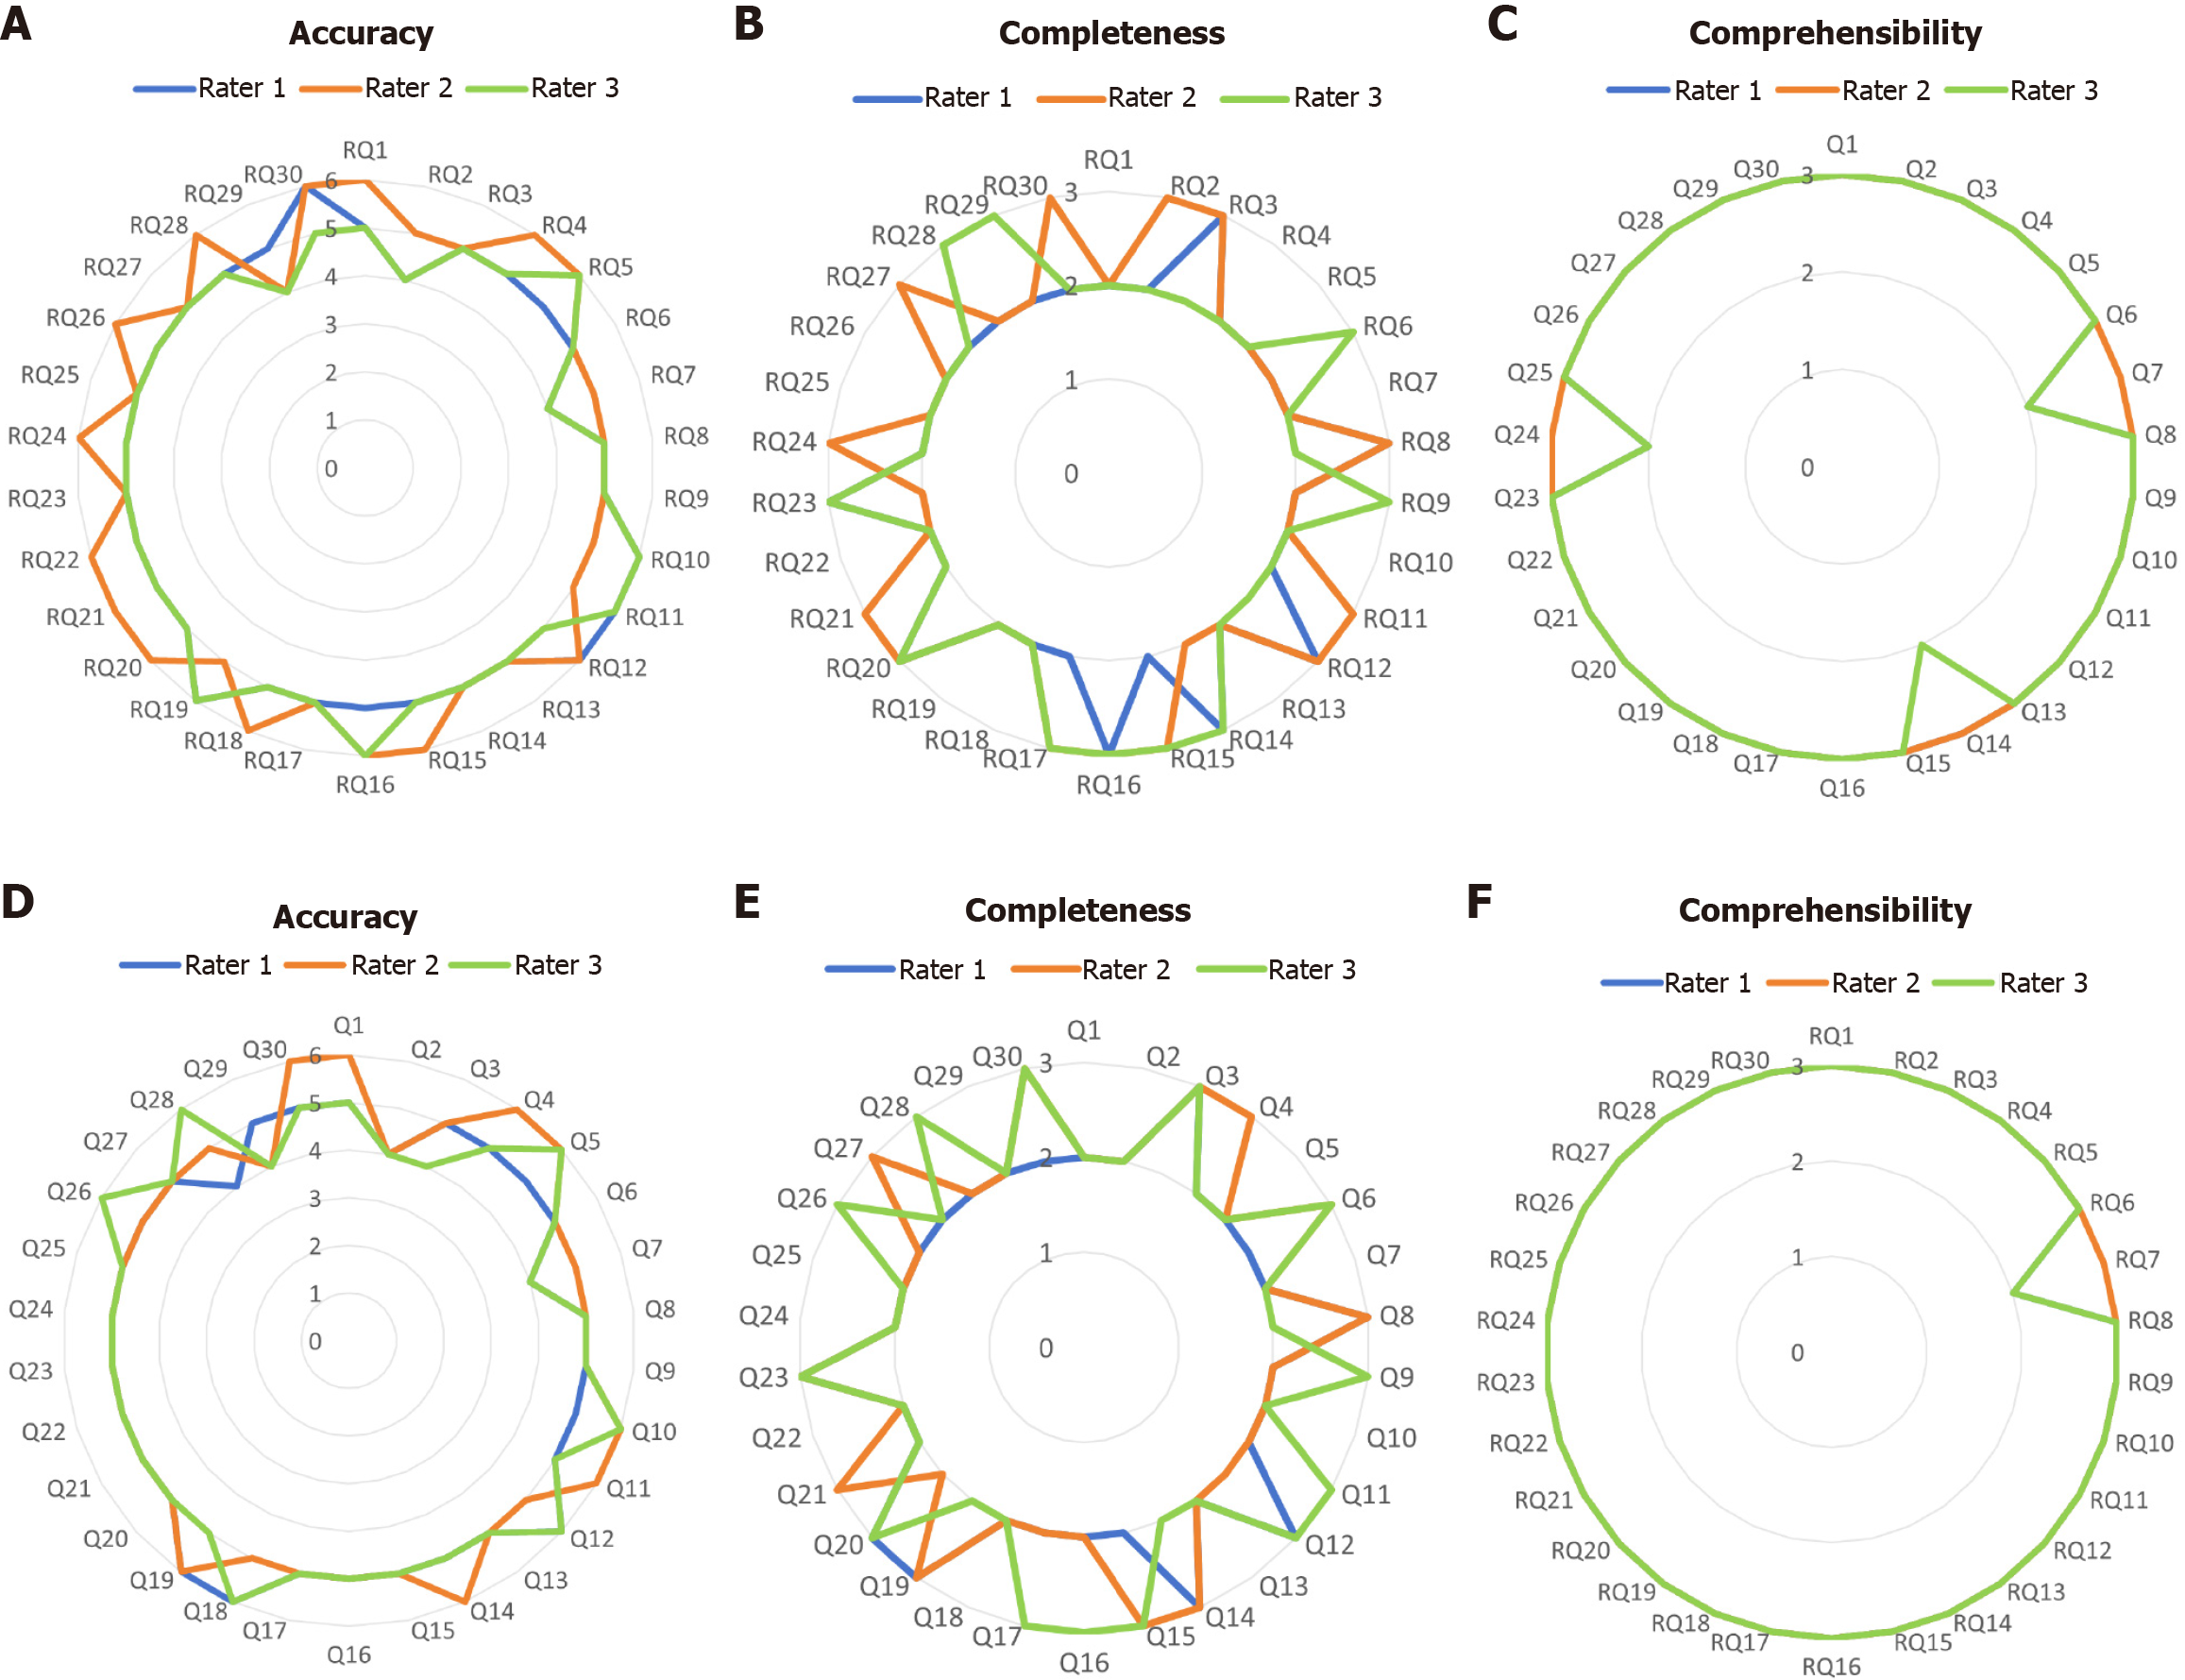
Figure 3 Distribution of expert ratings by topic for each question during the discovery and replication phases, presented as a radar chart.
A-C: The discovery phases; D-F: Replication phases. When the curves representing the ratings of different reviewers were closer within the circles, a greater degree of agreement was indicated. The farther a curve extended toward the outer edge of the graph, the higher the score given by the reviewer. Q: Question; RQ: Replication question.
- Citation: Wang SS, Gao H, Lin PY, Qian TC, Du Y, Xu L. Evaluating chat generative pretrained transformer in answering questions on endoscopic mucosal resection and endoscopic submucosal dissection. World J Gastrointest Oncol 2025; 17(10): 109792
- URL: https://www.wjgnet.com/1948-5204/full/v17/i10/109792.htm
- DOI: https://dx.doi.org/10.4251/wjgo.v17.i10.109792