
















©The Author(s) 2024.
World J Gastrointest Oncol. Sep 15, 2024; 16(9): 3865-3874
Published online Sep 15, 2024. doi: 10.4251/wjgo.v16.i9.3865
Published online Sep 15, 2024. doi: 10.4251/wjgo.v16.i9.3865
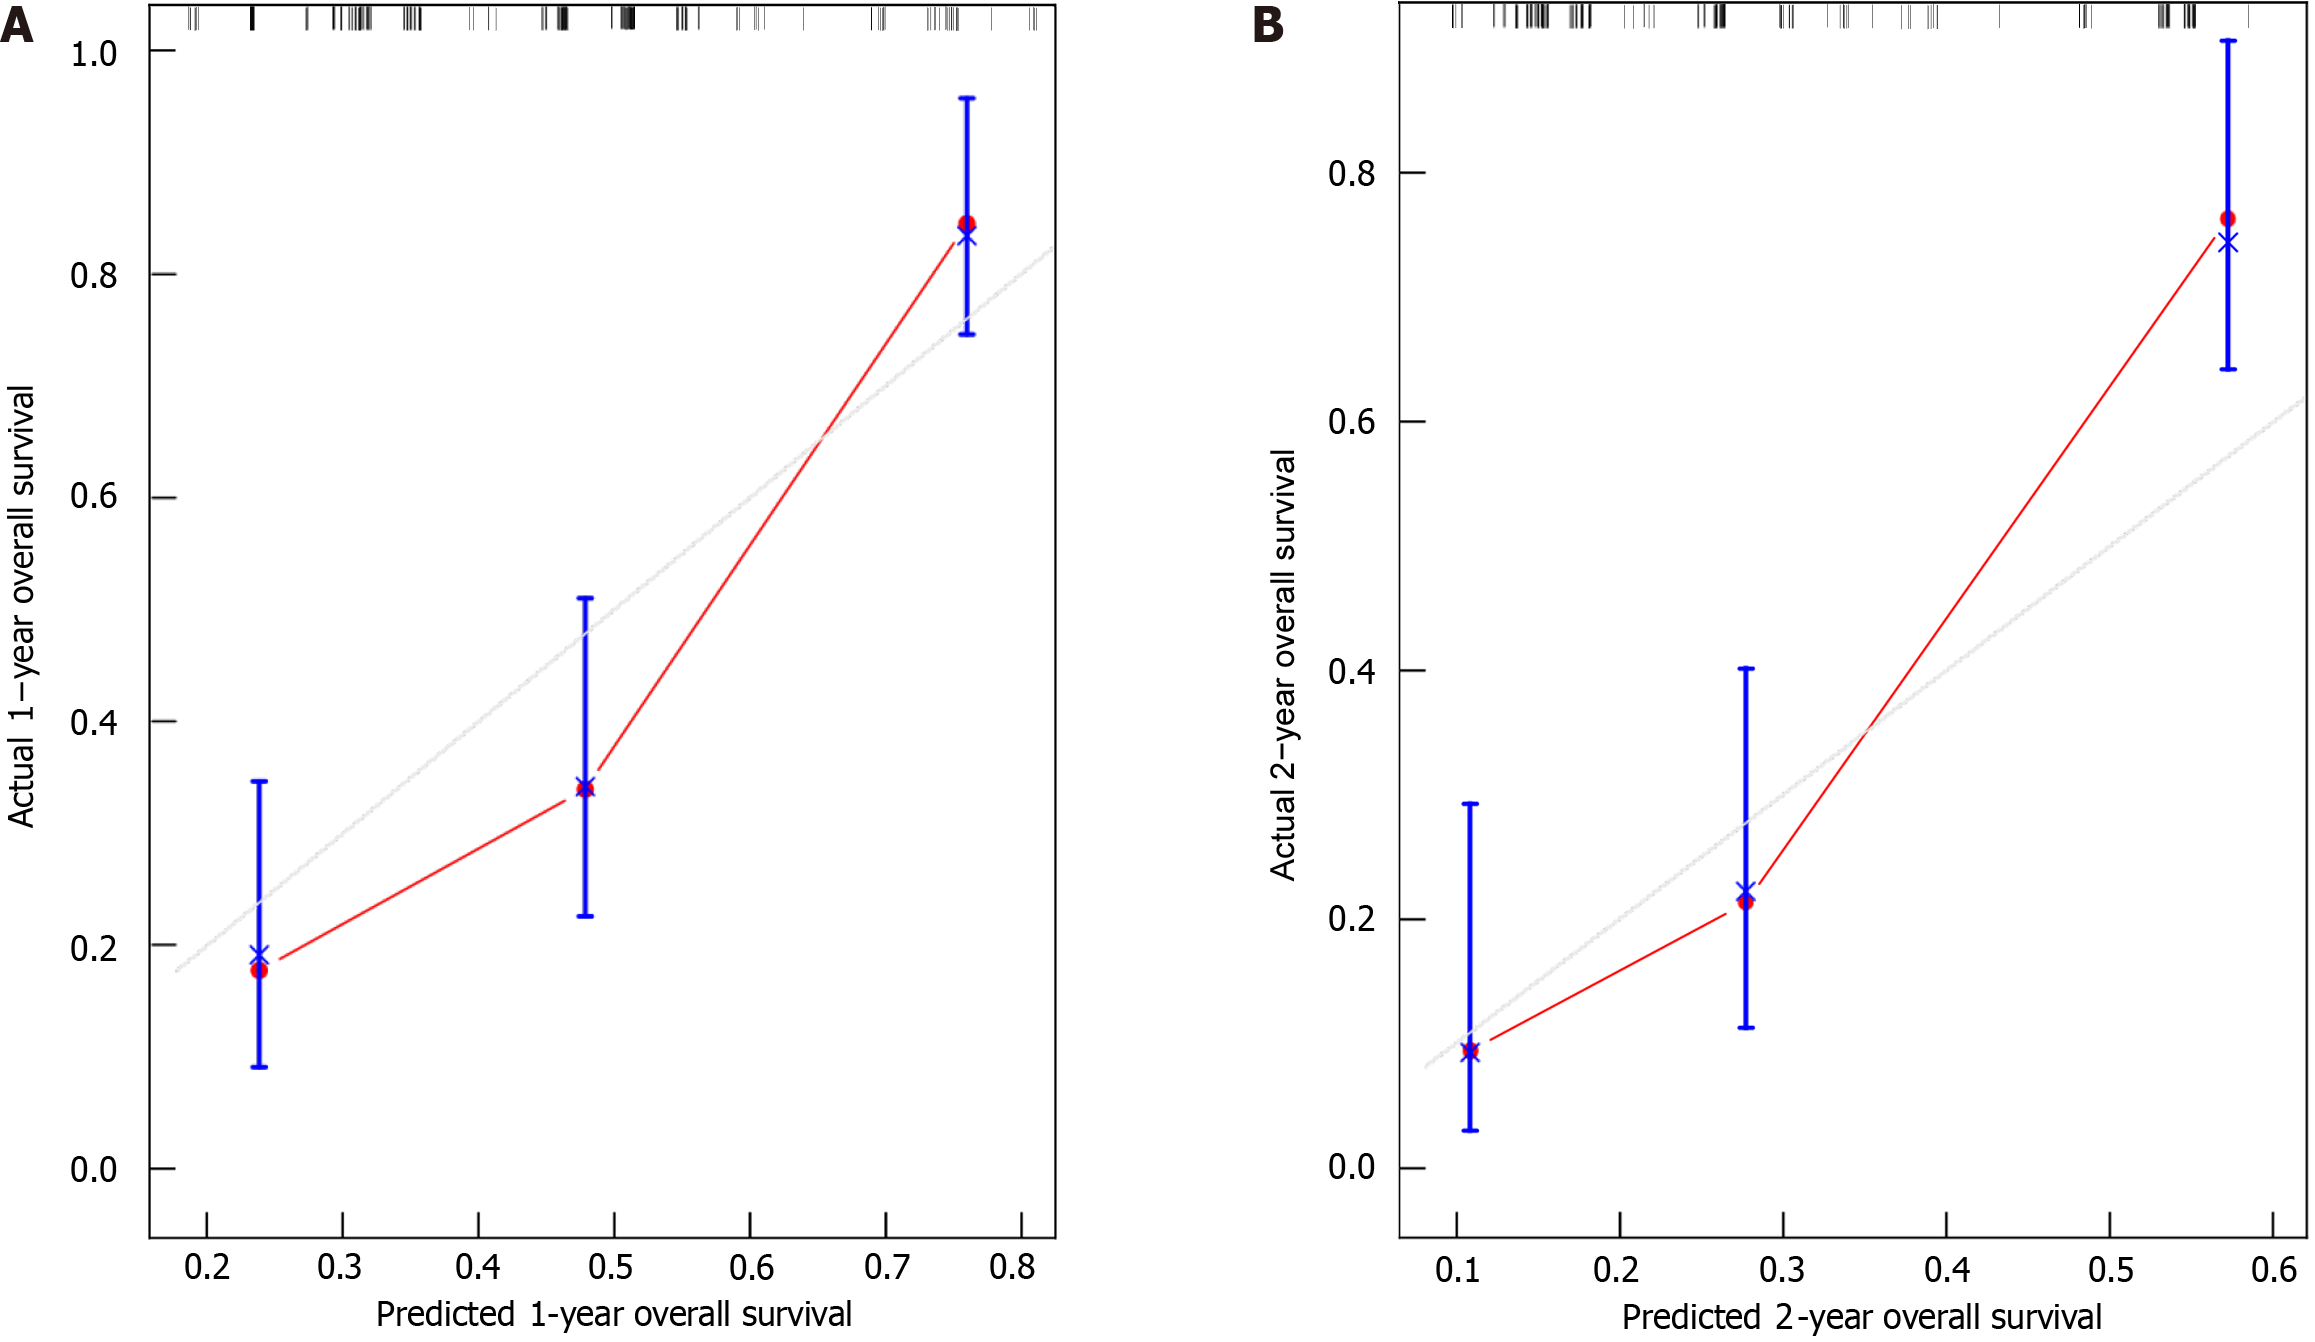
Figure 3 The 1-year and 2-year calibration plots of the nomogram.
A: 1-year; B: 2-year. While the vertical axes show the actual overall survival rates at 1 and 2 years, the horizontal axes show the nomogram-predicted probabilities of overall survival at those time points. The ideal forecast is indicated by the reference line that runs diagonally across the plot area, from the lower left to the top right corner.
- Citation: Wu ZJ, Lan B, Luo J, Ameti A, Wang H, Hu QY. Impact of preoperative inflammatory and nutritional markers on the prognosis of patients with peritoneal metastasis of colorectal cancer. World J Gastrointest Oncol 2024; 16(9): 3865-3874
- URL: https://www.wjgnet.com/1948-5204/full/v16/i9/3865.htm
- DOI: https://dx.doi.org/10.4251/wjgo.v16.i9.3865