
















©The Author(s) 2024.
World J Gastrointest Oncol. Jun 15, 2024; 16(6): 2571-2591
Published online Jun 15, 2024. doi: 10.4251/wjgo.v16.i6.2571
Published online Jun 15, 2024. doi: 10.4251/wjgo.v16.i6.2571
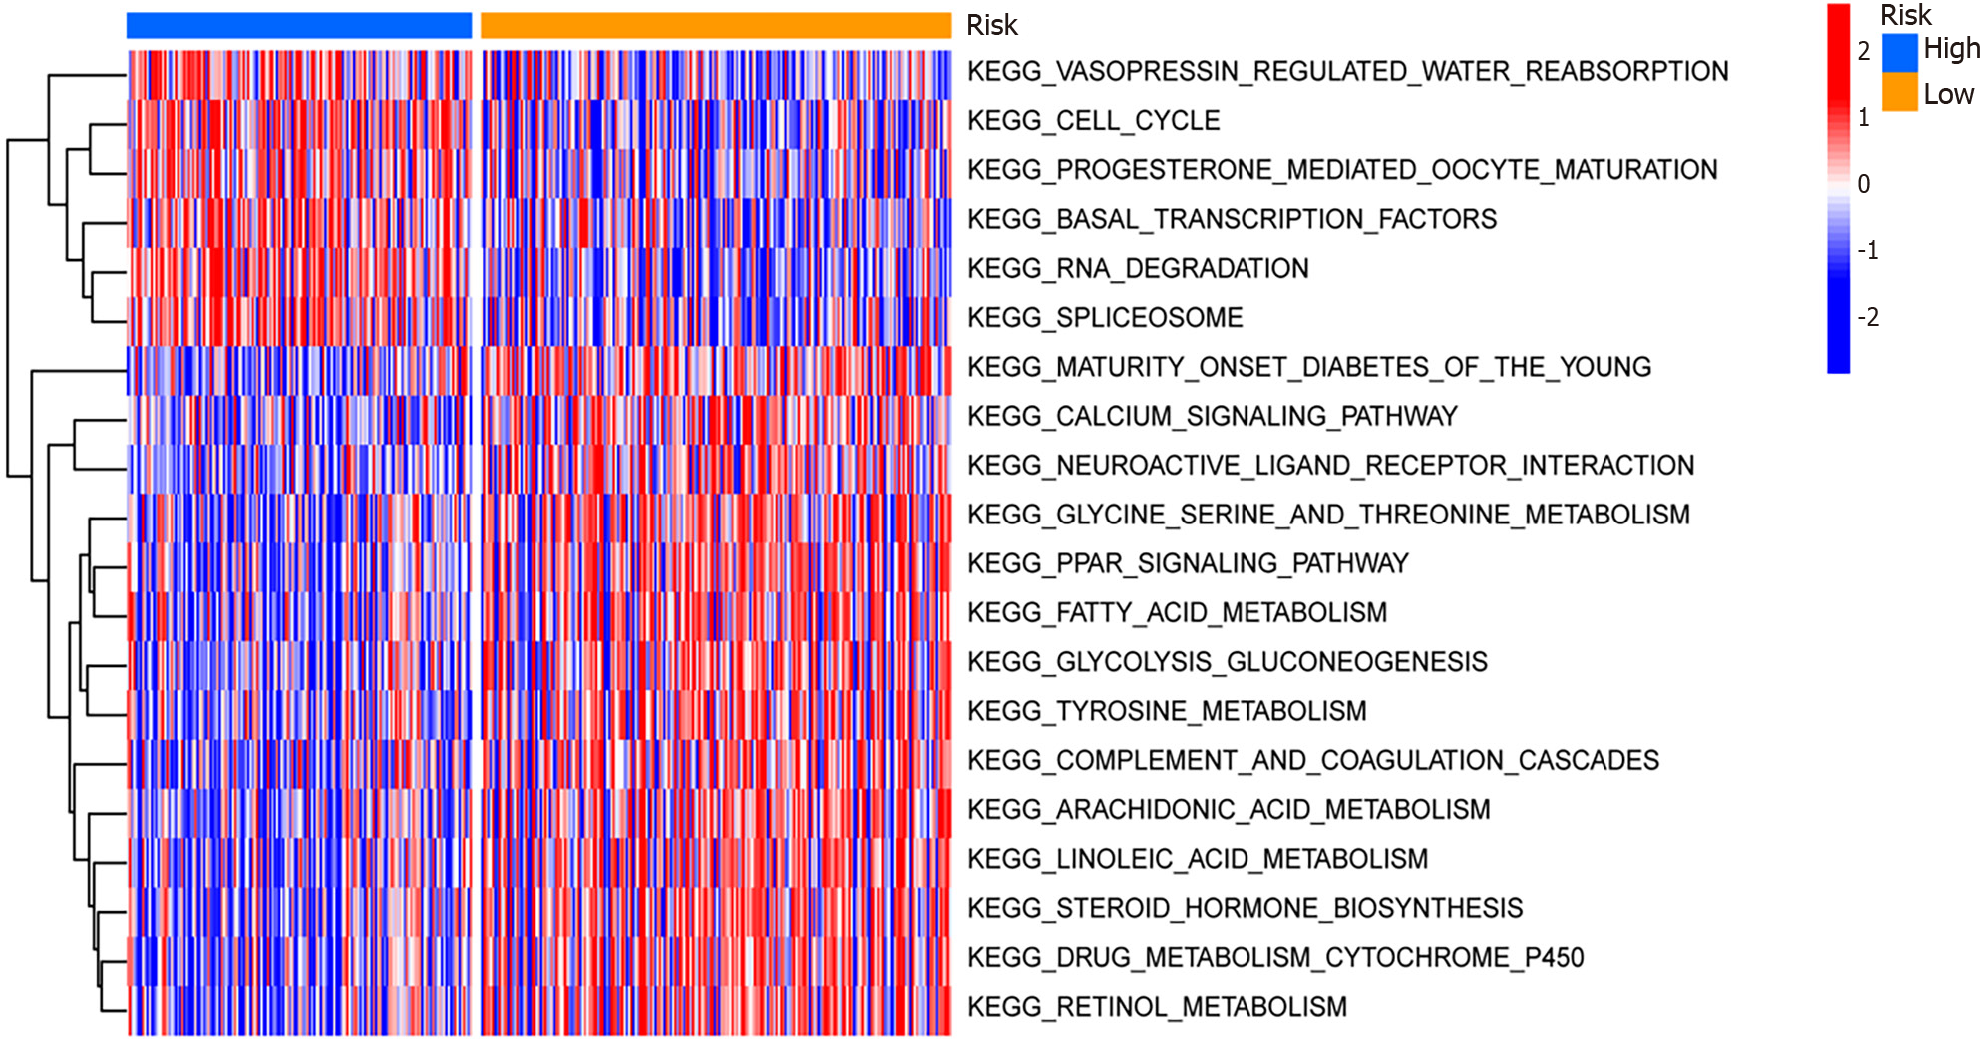
Figure 6 Gene Set Variation Analysis and Gene Set Enrichment Analysis of differential genes among high- and low-risk groups within The Cancer Genome Atlas-Liver Hepatocellular Carcinoma, GSE25097, and GSE36376 combined datasets.
The main biological functions and pathway heat maps obtained from Gene Set Variation Analysis are displayed. Blue indicates low risk, and yellow indicates high risk. Red represents overexpression in this pathway, and blue indicates under-expression in this pathway. KEGG: Kyoto Encyclopedia of Genes and Genomes.
- Citation: Ren QS, Sun Q, Cheng SQ, Du LM, Guo PX. Hepatocellular carcinoma: An analysis of the expression status of stress granules and their prognostic value. World J Gastrointest Oncol 2024; 16(6): 2571-2591
- URL: https://www.wjgnet.com/1948-5204/full/v16/i6/2571.htm
- DOI: https://dx.doi.org/10.4251/wjgo.v16.i6.2571