Copyright
©The Author(s) 2024.
World J Gastrointest Oncol. Apr 15, 2024; 16(4): 1500-1513
Published online Apr 15, 2024. doi: 10.4251/wjgo.v16.i4.1500
Published online Apr 15, 2024. doi: 10.4251/wjgo.v16.i4.1500
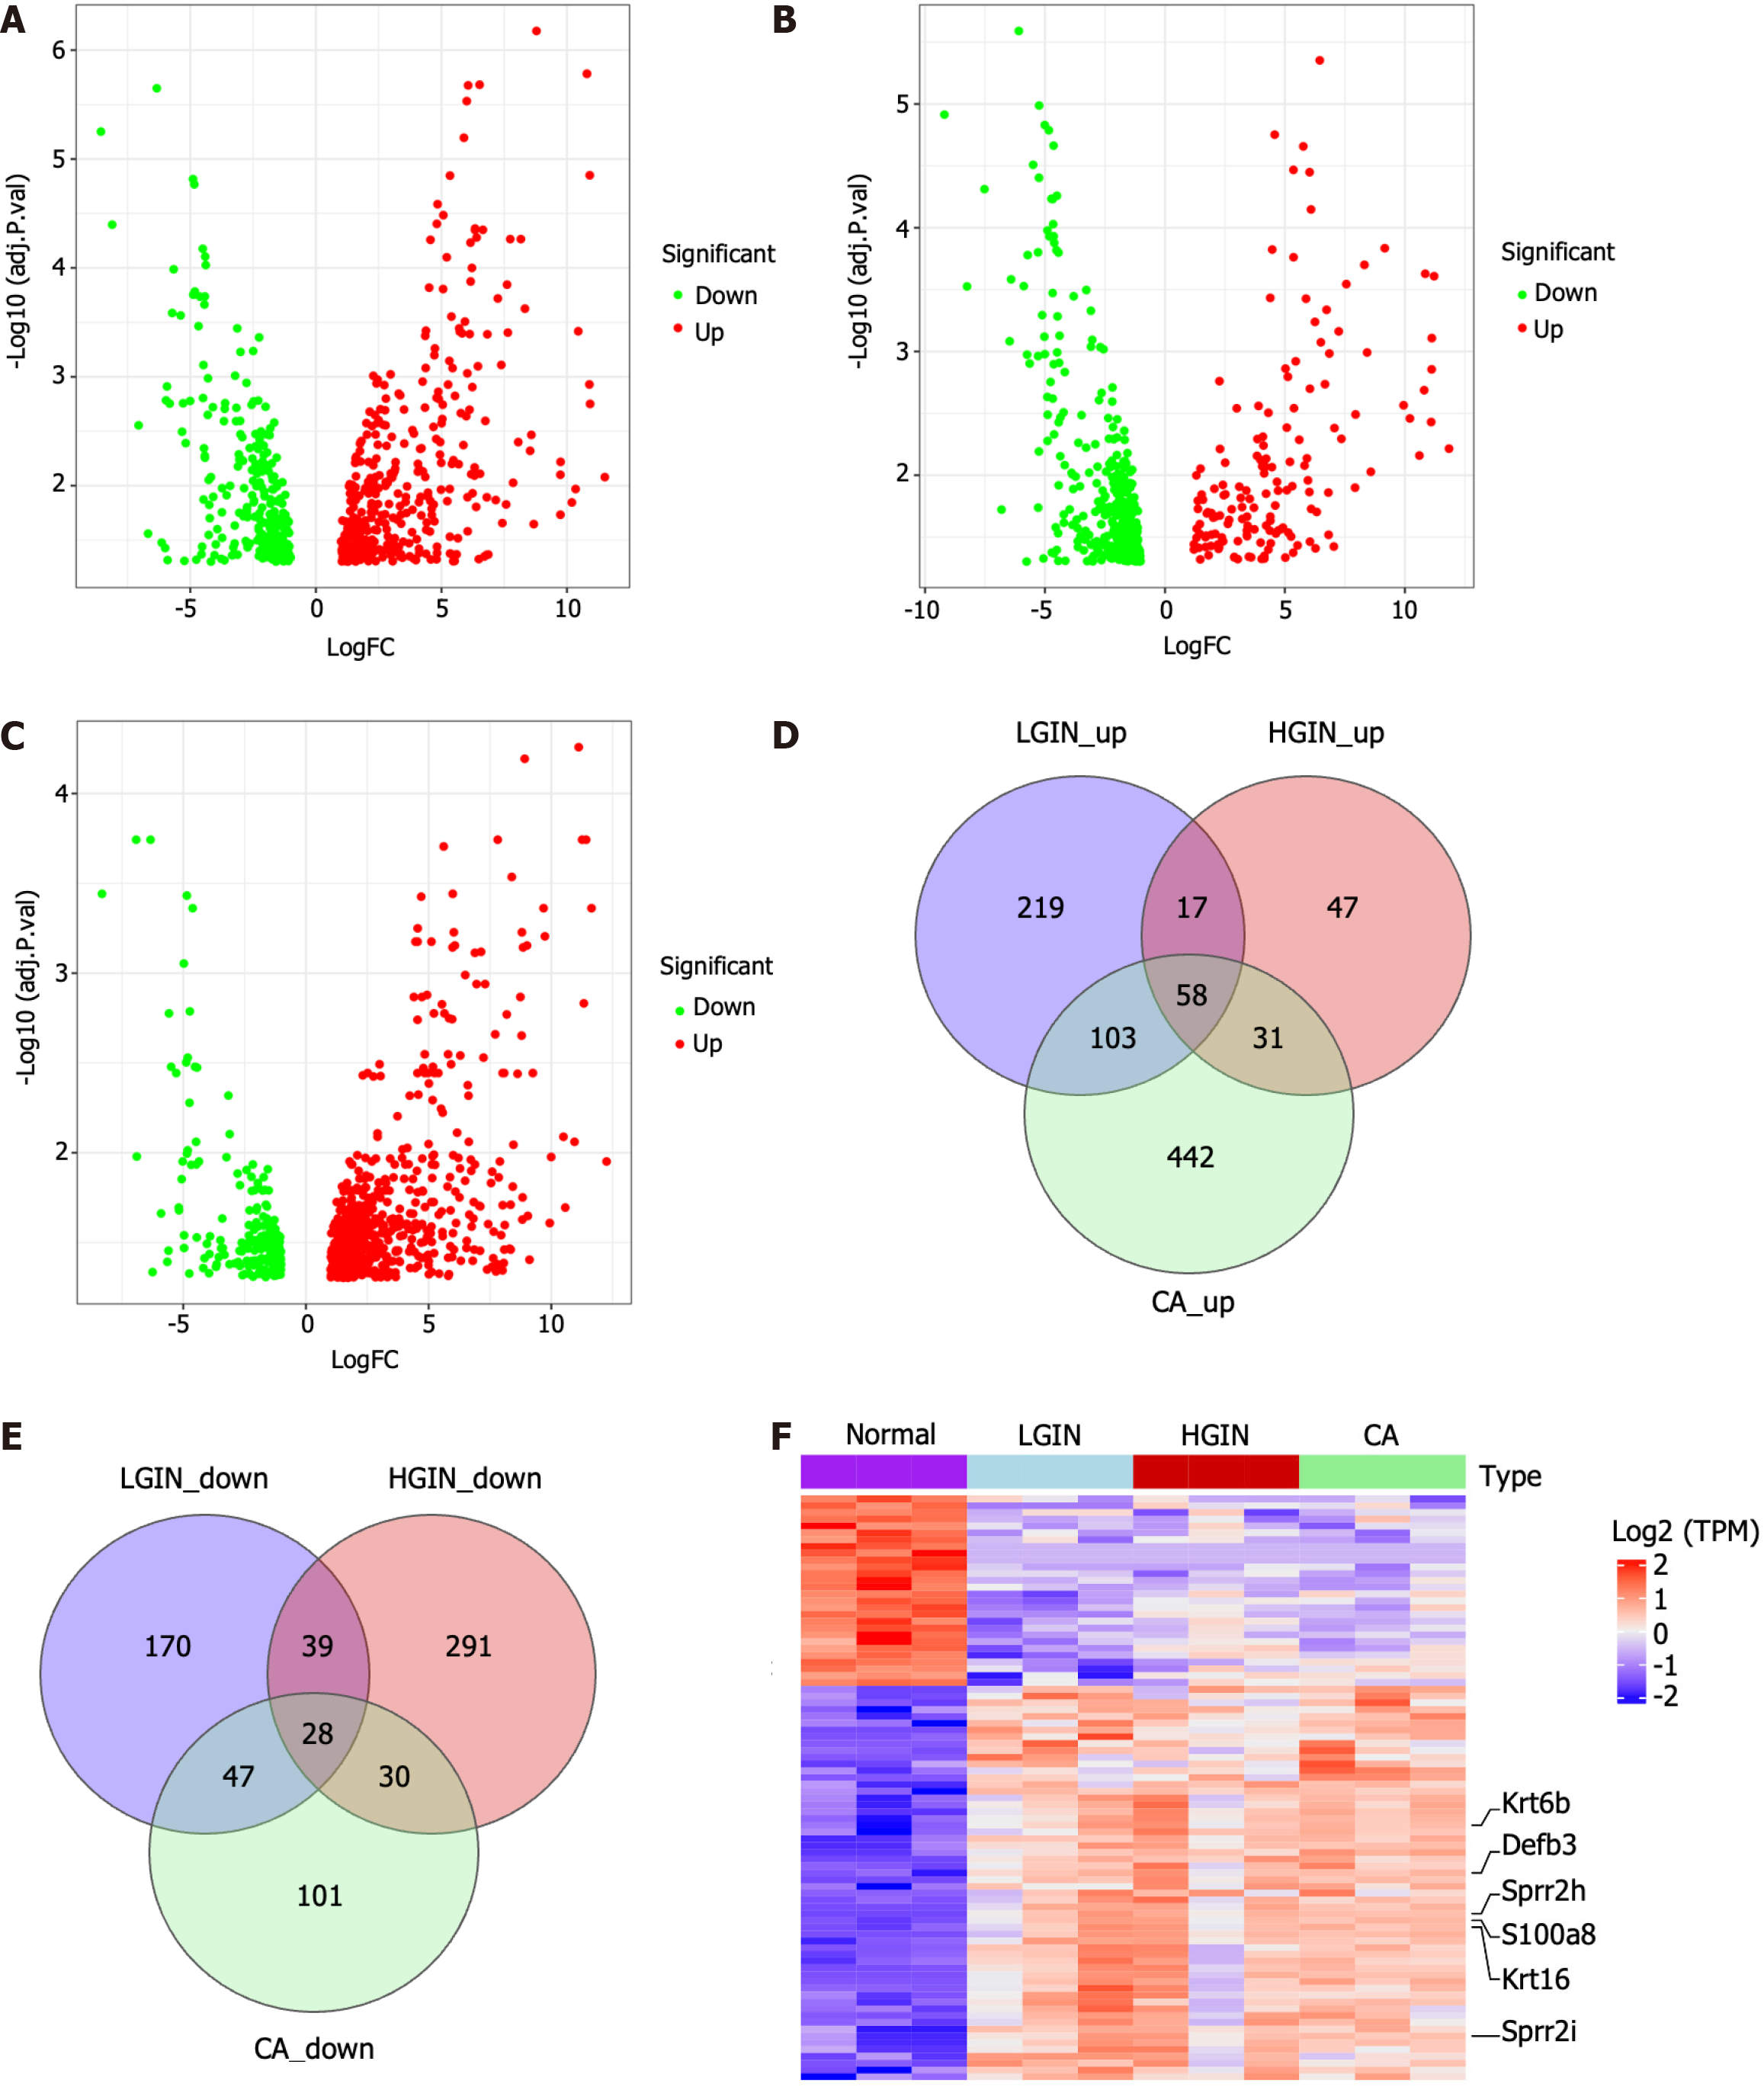
Figure 2 Differentially expressed gene analysis and identification of key genes in development of esophageal carcinogenesis.
A-C: The volcano plots show the differentially expressed genes (DEGs) for low-grade intraepithelial neoplasia, high-grade intraepithelial neoplasia, and carcinoma (CA) compared to the normal, respectively; D and E: Venn diagrams of up-regulated and down-regulated DEGs; F: Heatmap of the 86 key genes. LGIN: Low-grade intraepithelial neoplasia; HGIN: High-grade intraepithelial neoplasia; CA: Carcinoma; NOR: Normal; TPM: Transcript per Kilobase per Million mapped reads.
- Citation: Sun JR, Chen DM, Huang R, Wang RT, Jia LQ. Transcriptome sequencing reveals novel biomarkers and immune cell infiltration in esophageal tumorigenesis. World J Gastrointest Oncol 2024; 16(4): 1500-1513
- URL: https://www.wjgnet.com/1948-5204/full/v16/i4/1500.htm
- DOI: https://dx.doi.org/10.4251/wjgo.v16.i4.1500


