Copyright
©The Author(s) 2024.
World J Gastrointest Oncol. Apr 15, 2024; 16(4): 1465-1478
Published online Apr 15, 2024. doi: 10.4251/wjgo.v16.i4.1465
Published online Apr 15, 2024. doi: 10.4251/wjgo.v16.i4.1465
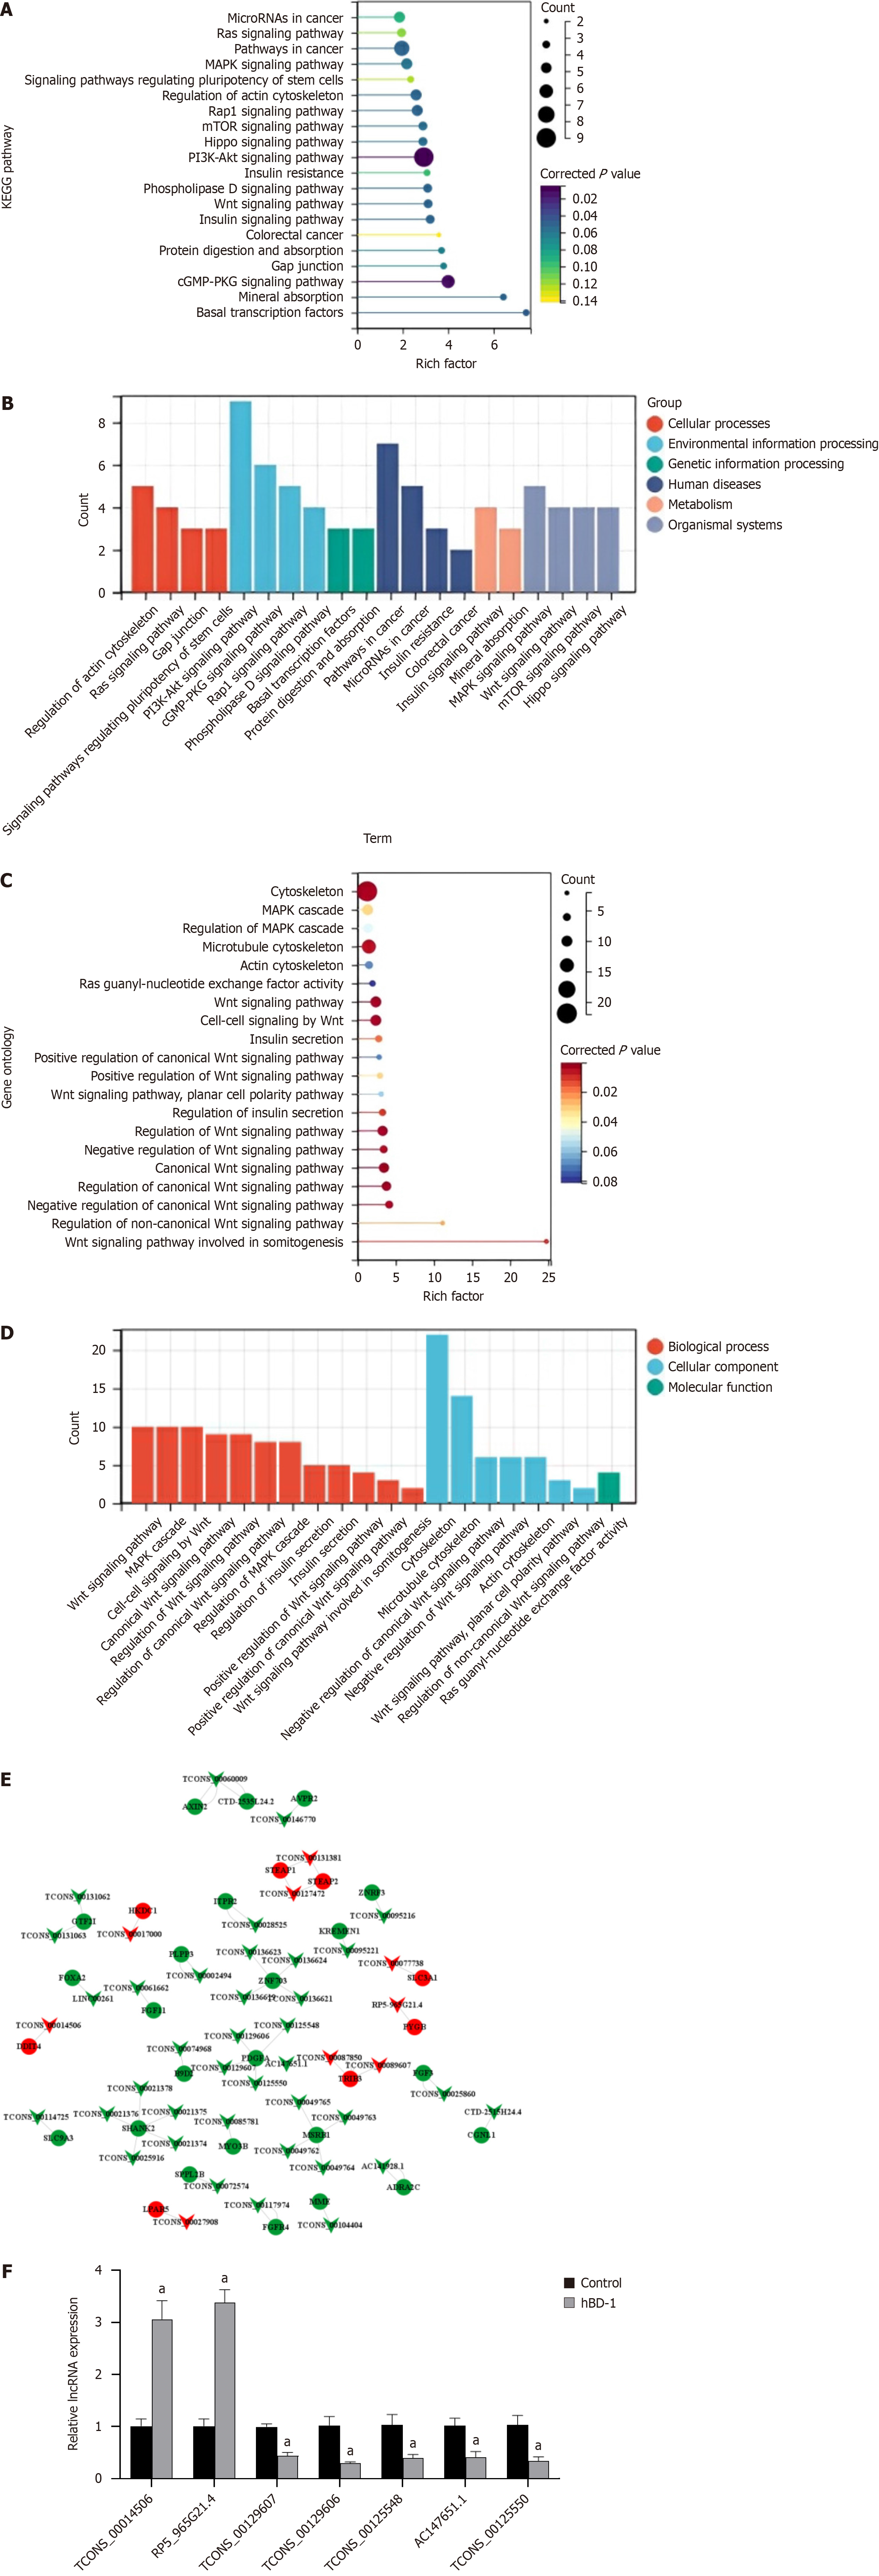
Figure 3 Bioinformatics analysis of differentially expressed long non-coding RNAs and selection of the target long non-coding RNA.
A: KEGG pathway enrichment analysis. The bubble size denotes the number of long non-coding RNAs (lncRNAs) target genes enriched in this pathway. Larger bubbles denote a higher number of target genes associated with the pathway. Darker color indicates more significant enrichment. The abscissa count indicates the number of genes in this pathway, and the ordinate signifies the KEGG pathway; B: GO pathway enrichment analysis. Bubble size signifies the number of lncRNA target genes enriched in this pathway, with a larger bubble indicating a larger number of target genes. Darker color indicates more significant enrichment. The abscissa count denotes the number of target genes, and the ordinate denotes a GO term; C: Co-expression analysis of differentially expressed lncRNAs and differentially expressed mRNAs. Inverted triangles indicate lncRNAs, circles indicate mRNAs, red color indicates upregulated expression, and green color indicates downregulated expression; D: KEGG pathways classification analysis. From left to right are cellular processes, environmental information processing, genetic information processing, and human diseases, metabolism, organismal systems; E: GO pathways classification analysis. Red parts indicate biological processes, blue parts indicate cellular components, and green parts indicate molecular function; F: LncRNA expression was detected via qRT-PCR. aP < 0.05 vs control group. hBD-1: Human β-defensin-1.
- Citation: Zhao YX, Cui Y, Li XH, Yang WH, An SX, Cui JX, Zhang MY, Lu JK, Zhang X, Wang XM, Bao LL, Zhao PW. Human β-defensin-1 affects the mammalian target of rapamycin pathway and autophagy in colon cancer cells through long non-coding RNA TCONS_00014506. World J Gastrointest Oncol 2024; 16(4): 1465-1478
- URL: https://www.wjgnet.com/1948-5204/full/v16/i4/1465.htm
- DOI: https://dx.doi.org/10.4251/wjgo.v16.i4.1465


