Copyright
©The Author(s) 2024.
World J Gastrointest Oncol. Apr 15, 2024; 16(4): 1465-1478
Published online Apr 15, 2024. doi: 10.4251/wjgo.v16.i4.1465
Published online Apr 15, 2024. doi: 10.4251/wjgo.v16.i4.1465
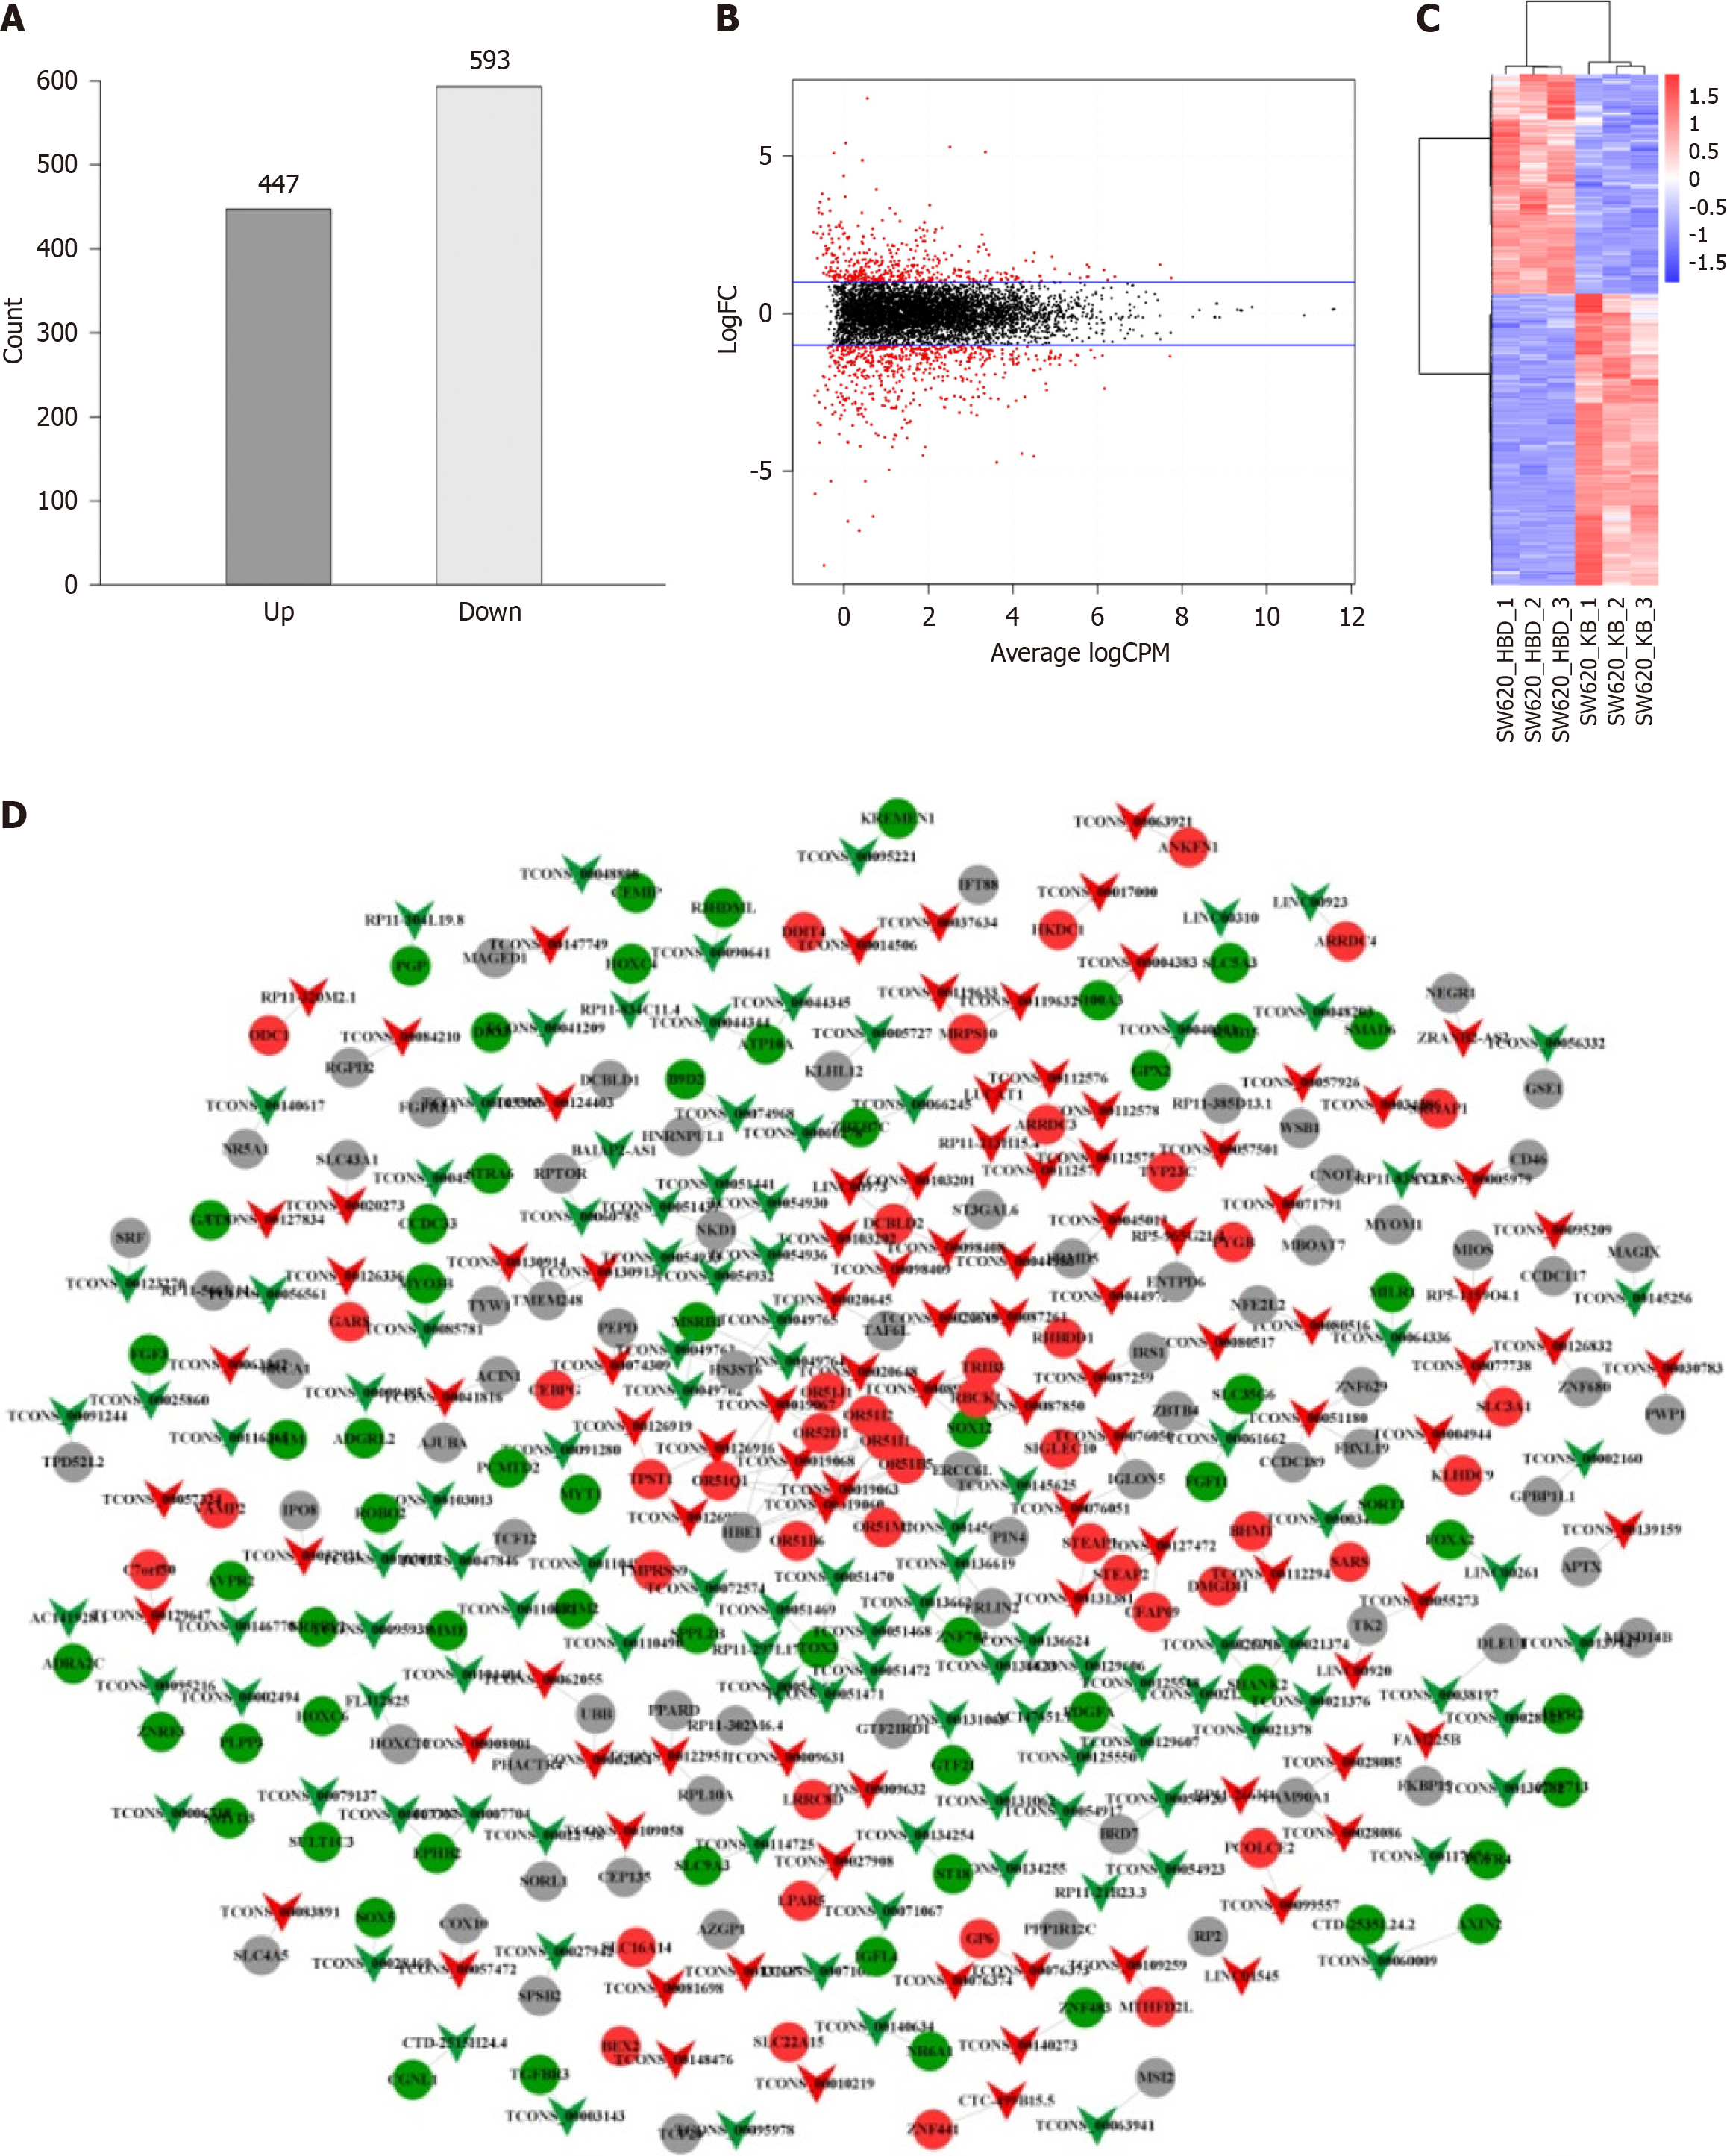
Figure 2 Differential expression analysis of long non-coding RNAs.
A: Histogram of differentially expressed long non-coding RNAs (lncRNAs); B: Volcano plot of differentially expressed lncRNAs. The two blue lines in the figure signify the threshold for downregulating genes with differential expression on the upper panel (logFC > 1 indicates upregulation and logFC < -1 indicates downregulation), where black represents no differentially expressed lncRNAs and red represents differentially expressed lncRNAs; C: Cluster analysis of differentially expressed lncRNAs. The horizontal axis denotes lncRNAs from different samples, each listed as a sample, red denotes highly expressed lncRNAs, and blue denotes lncRNAs with decreased expression. The vertical axis corresponds to gene names, where each row denotes an individual gene. The color scale is used to indicate the abundance of gene expression, with red denoting significant upregulation and blue denoting significant downregulation; D: Relationship between differentially expressed lncRNAs and mRNAs targeted. Inverted triangles denote lncRNAs, circles denote mRNAs, red denotes upregulated expression, green denotes downregulated expression, and gray denotes no difference in expression.
- Citation: Zhao YX, Cui Y, Li XH, Yang WH, An SX, Cui JX, Zhang MY, Lu JK, Zhang X, Wang XM, Bao LL, Zhao PW. Human β-defensin-1 affects the mammalian target of rapamycin pathway and autophagy in colon cancer cells through long non-coding RNA TCONS_00014506. World J Gastrointest Oncol 2024; 16(4): 1465-1478
- URL: https://www.wjgnet.com/1948-5204/full/v16/i4/1465.htm
- DOI: https://dx.doi.org/10.4251/wjgo.v16.i4.1465


