Copyright
©The Author(s) 2024.
World J Gastrointest Oncol. Apr 15, 2024; 16(4): 1344-1360
Published online Apr 15, 2024. doi: 10.4251/wjgo.v16.i4.1344
Published online Apr 15, 2024. doi: 10.4251/wjgo.v16.i4.1344
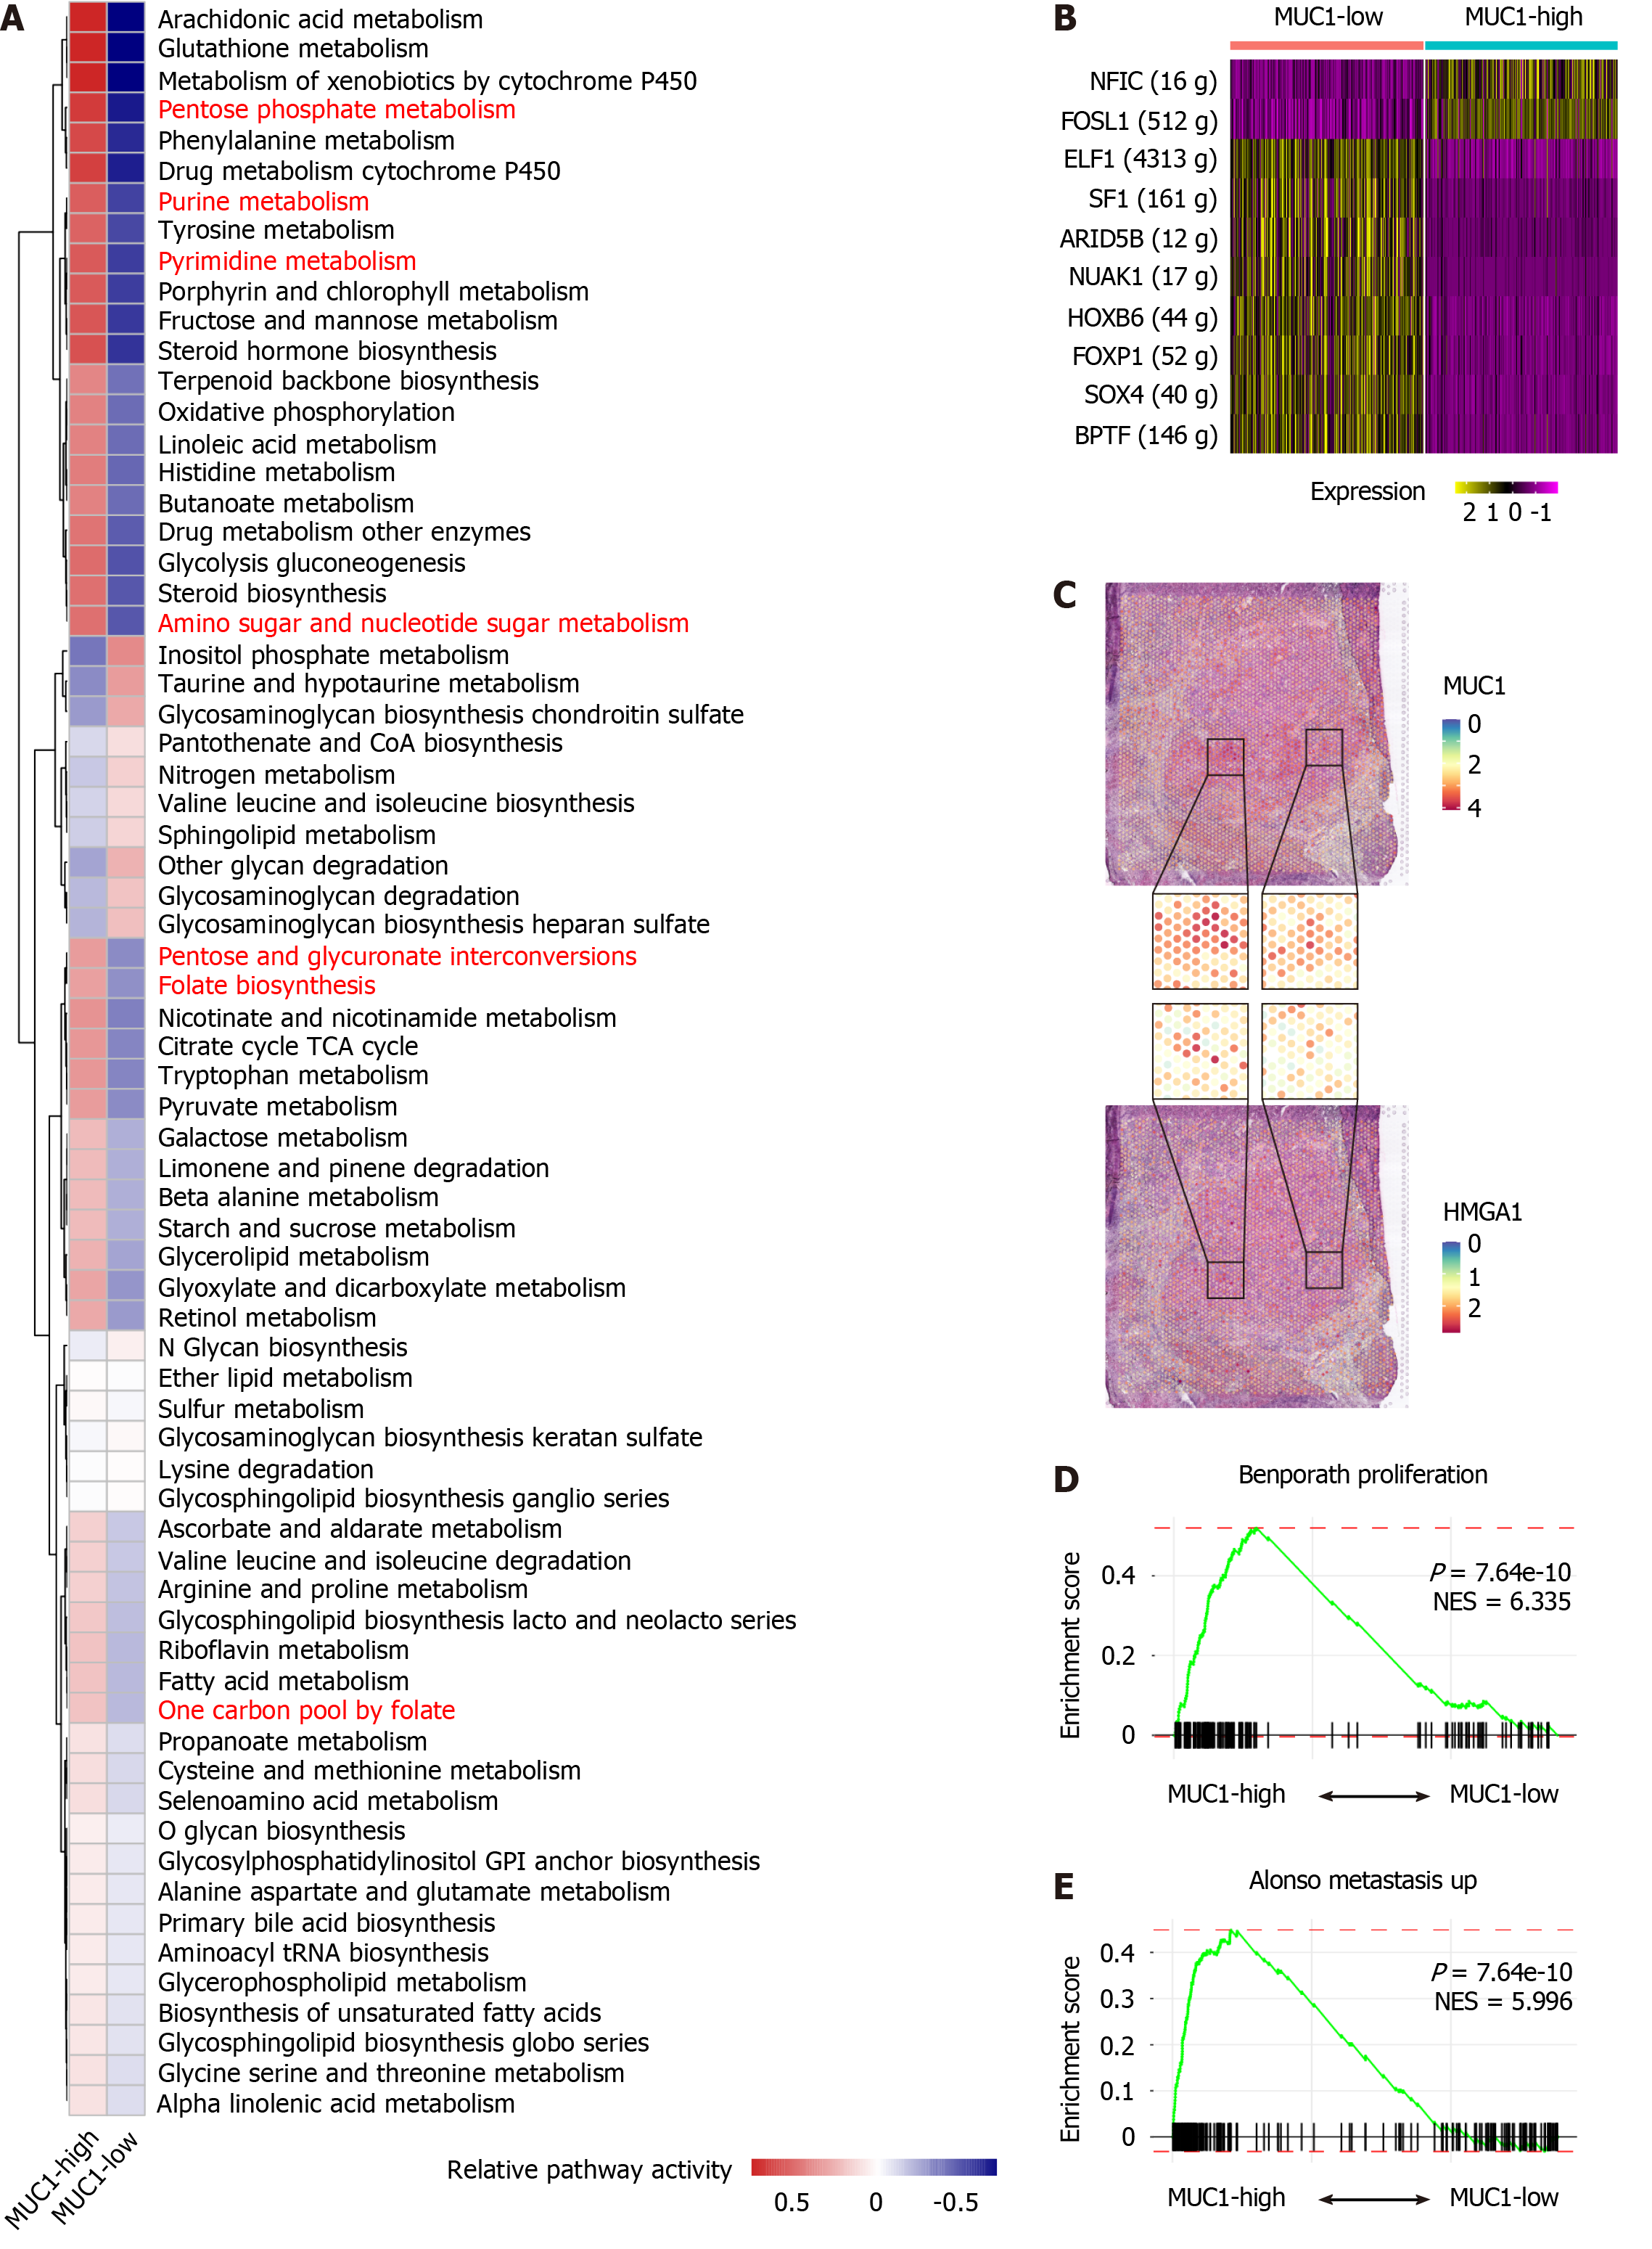
Figure 2 Activated nucleotide metabolic signaling and higher malignant characteristics in MUC1-high tumor cells of cholangiocarcinoma.
A: Heatmap showing the activity of metabolic signaling pathways in MUC1-high vs MUC1-low cells; B: Heatmap showing the different expression levels of transcription factors in MUC1-high cells vs MUC1-low cells; C: Distribution of MUC1 and HMGA1 in the spatial transcriptomics (ST) slide. Zoomed in portions of the ST chip (middle) showing multiple areas of co-localization; D and E: Gene set enrichment analysis plots showing the enrichment of genes from MUC1-high cells (left) vs MUC1-low cells (right) in cell proliferation and metastasis signaling pathways. The P values and normalized enrichment score are indicated on the plots.
- Citation: Yang CY, Guo LM, Li Y, Wang GX, Tang XW, Zhang QL, Zhang LF, Luo JY. Establishment of a cholangiocarcinoma risk evaluation model based on mucin expression levels. World J Gastrointest Oncol 2024; 16(4): 1344-1360
- URL: https://www.wjgnet.com/1948-5204/full/v16/i4/1344.htm
- DOI: https://dx.doi.org/10.4251/wjgo.v16.i4.1344


