Copyright
©The Author(s) 2024.
World J Gastrointest Oncol. Apr 15, 2024; 16(4): 1213-1226
Published online Apr 15, 2024. doi: 10.4251/wjgo.v16.i4.1213
Published online Apr 15, 2024. doi: 10.4251/wjgo.v16.i4.1213
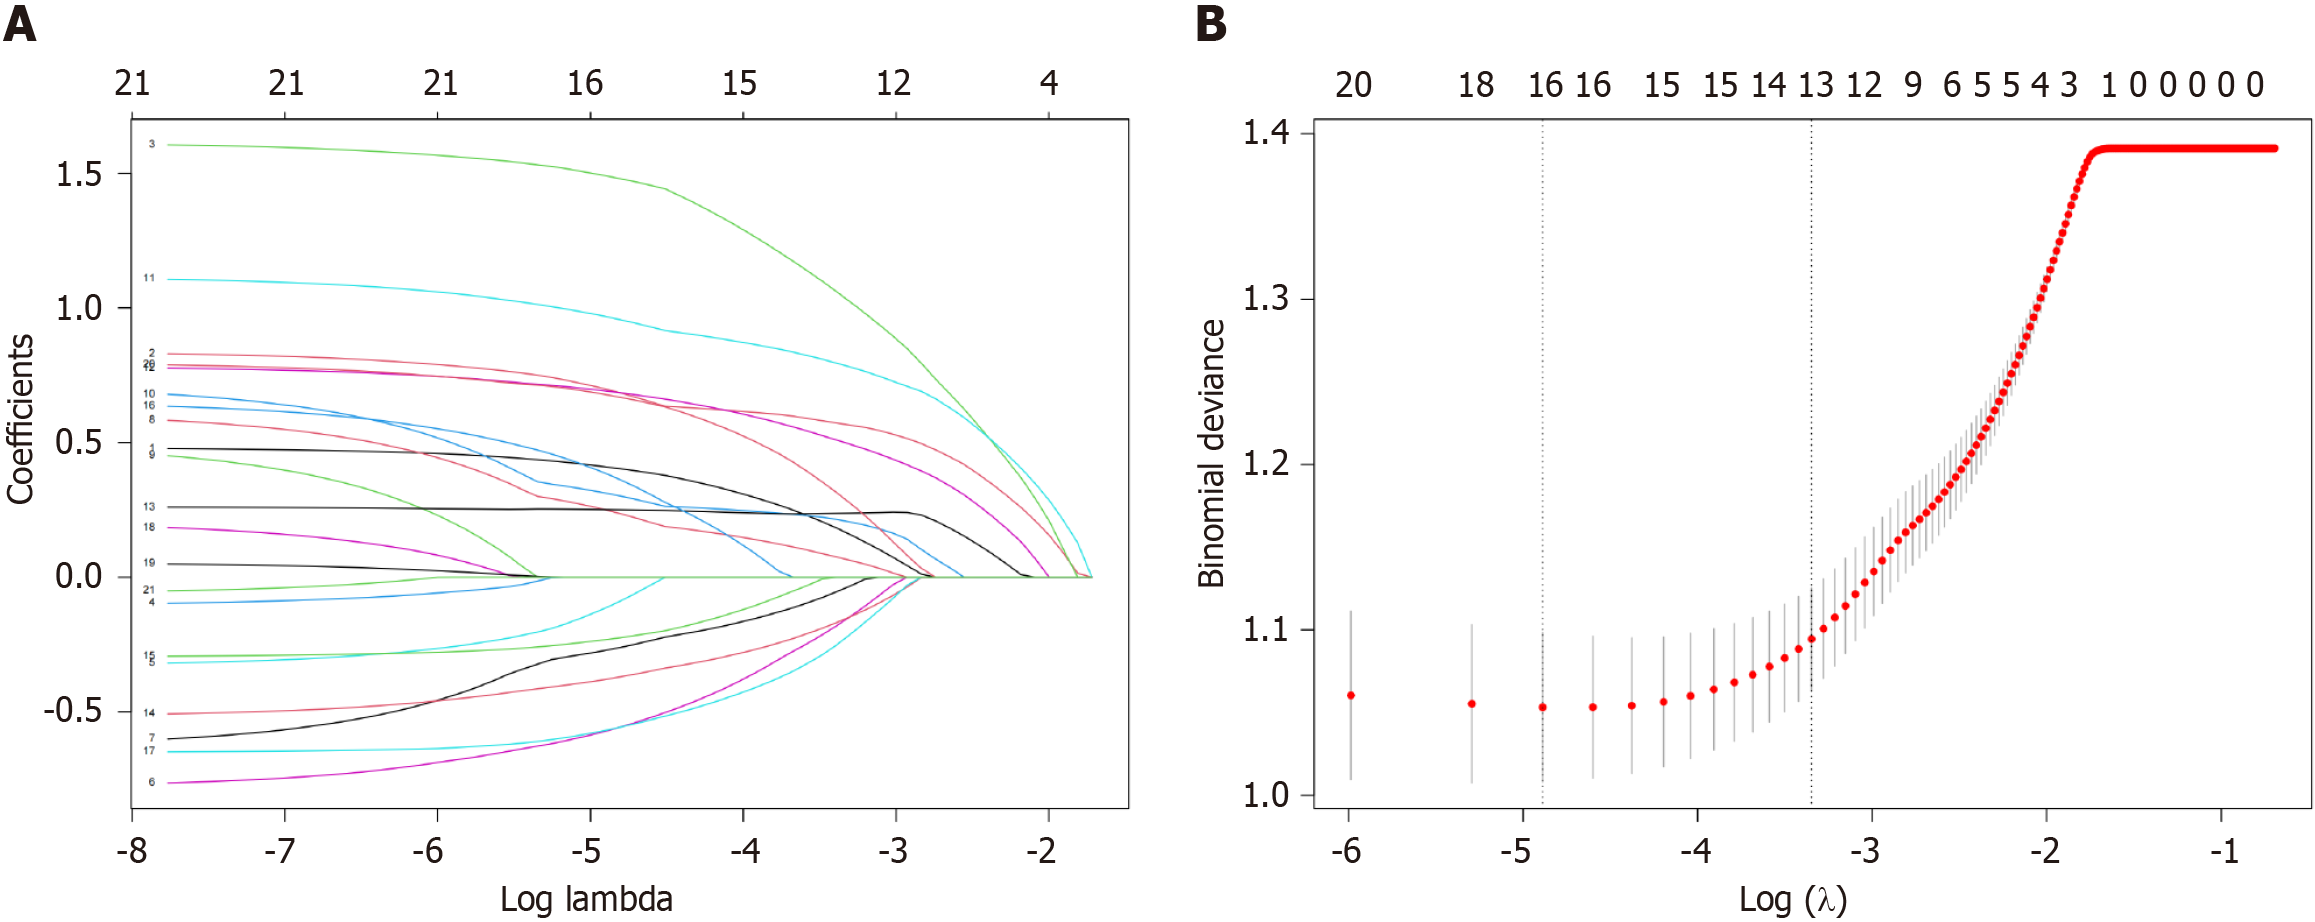
Figure 2 Predictor selection for least absolute shrinkage and selection operator regression analysis.
A: Least absolute shrinkage and selection operator coefficient profiles of the 21 variables; B: The mean−squared error was plotted vs log lambda. The left vertical dotted line shows the optimal values with the fewest criteria, whereas the right vertical dotted line reflects the single standard error criterion.
- Citation: Nie GL, Yan J, Li Y, Zhang HL, Xie DN, Zhu XW, Li X. Predictive model for non-malignant portal vein thrombosis associated with cirrhosis based on inflammatory biomarkers. World J Gastrointest Oncol 2024; 16(4): 1213-1226
- URL: https://www.wjgnet.com/1948-5204/full/v16/i4/1213.htm
- DOI: https://dx.doi.org/10.4251/wjgo.v16.i4.1213


