
















©The Author(s) 2024.
World J Gastrointest Oncol. Dec 15, 2024; 16(12): 4597-4613
Published online Dec 15, 2024. doi: 10.4251/wjgo.v16.i12.4597
Published online Dec 15, 2024. doi: 10.4251/wjgo.v16.i12.4597
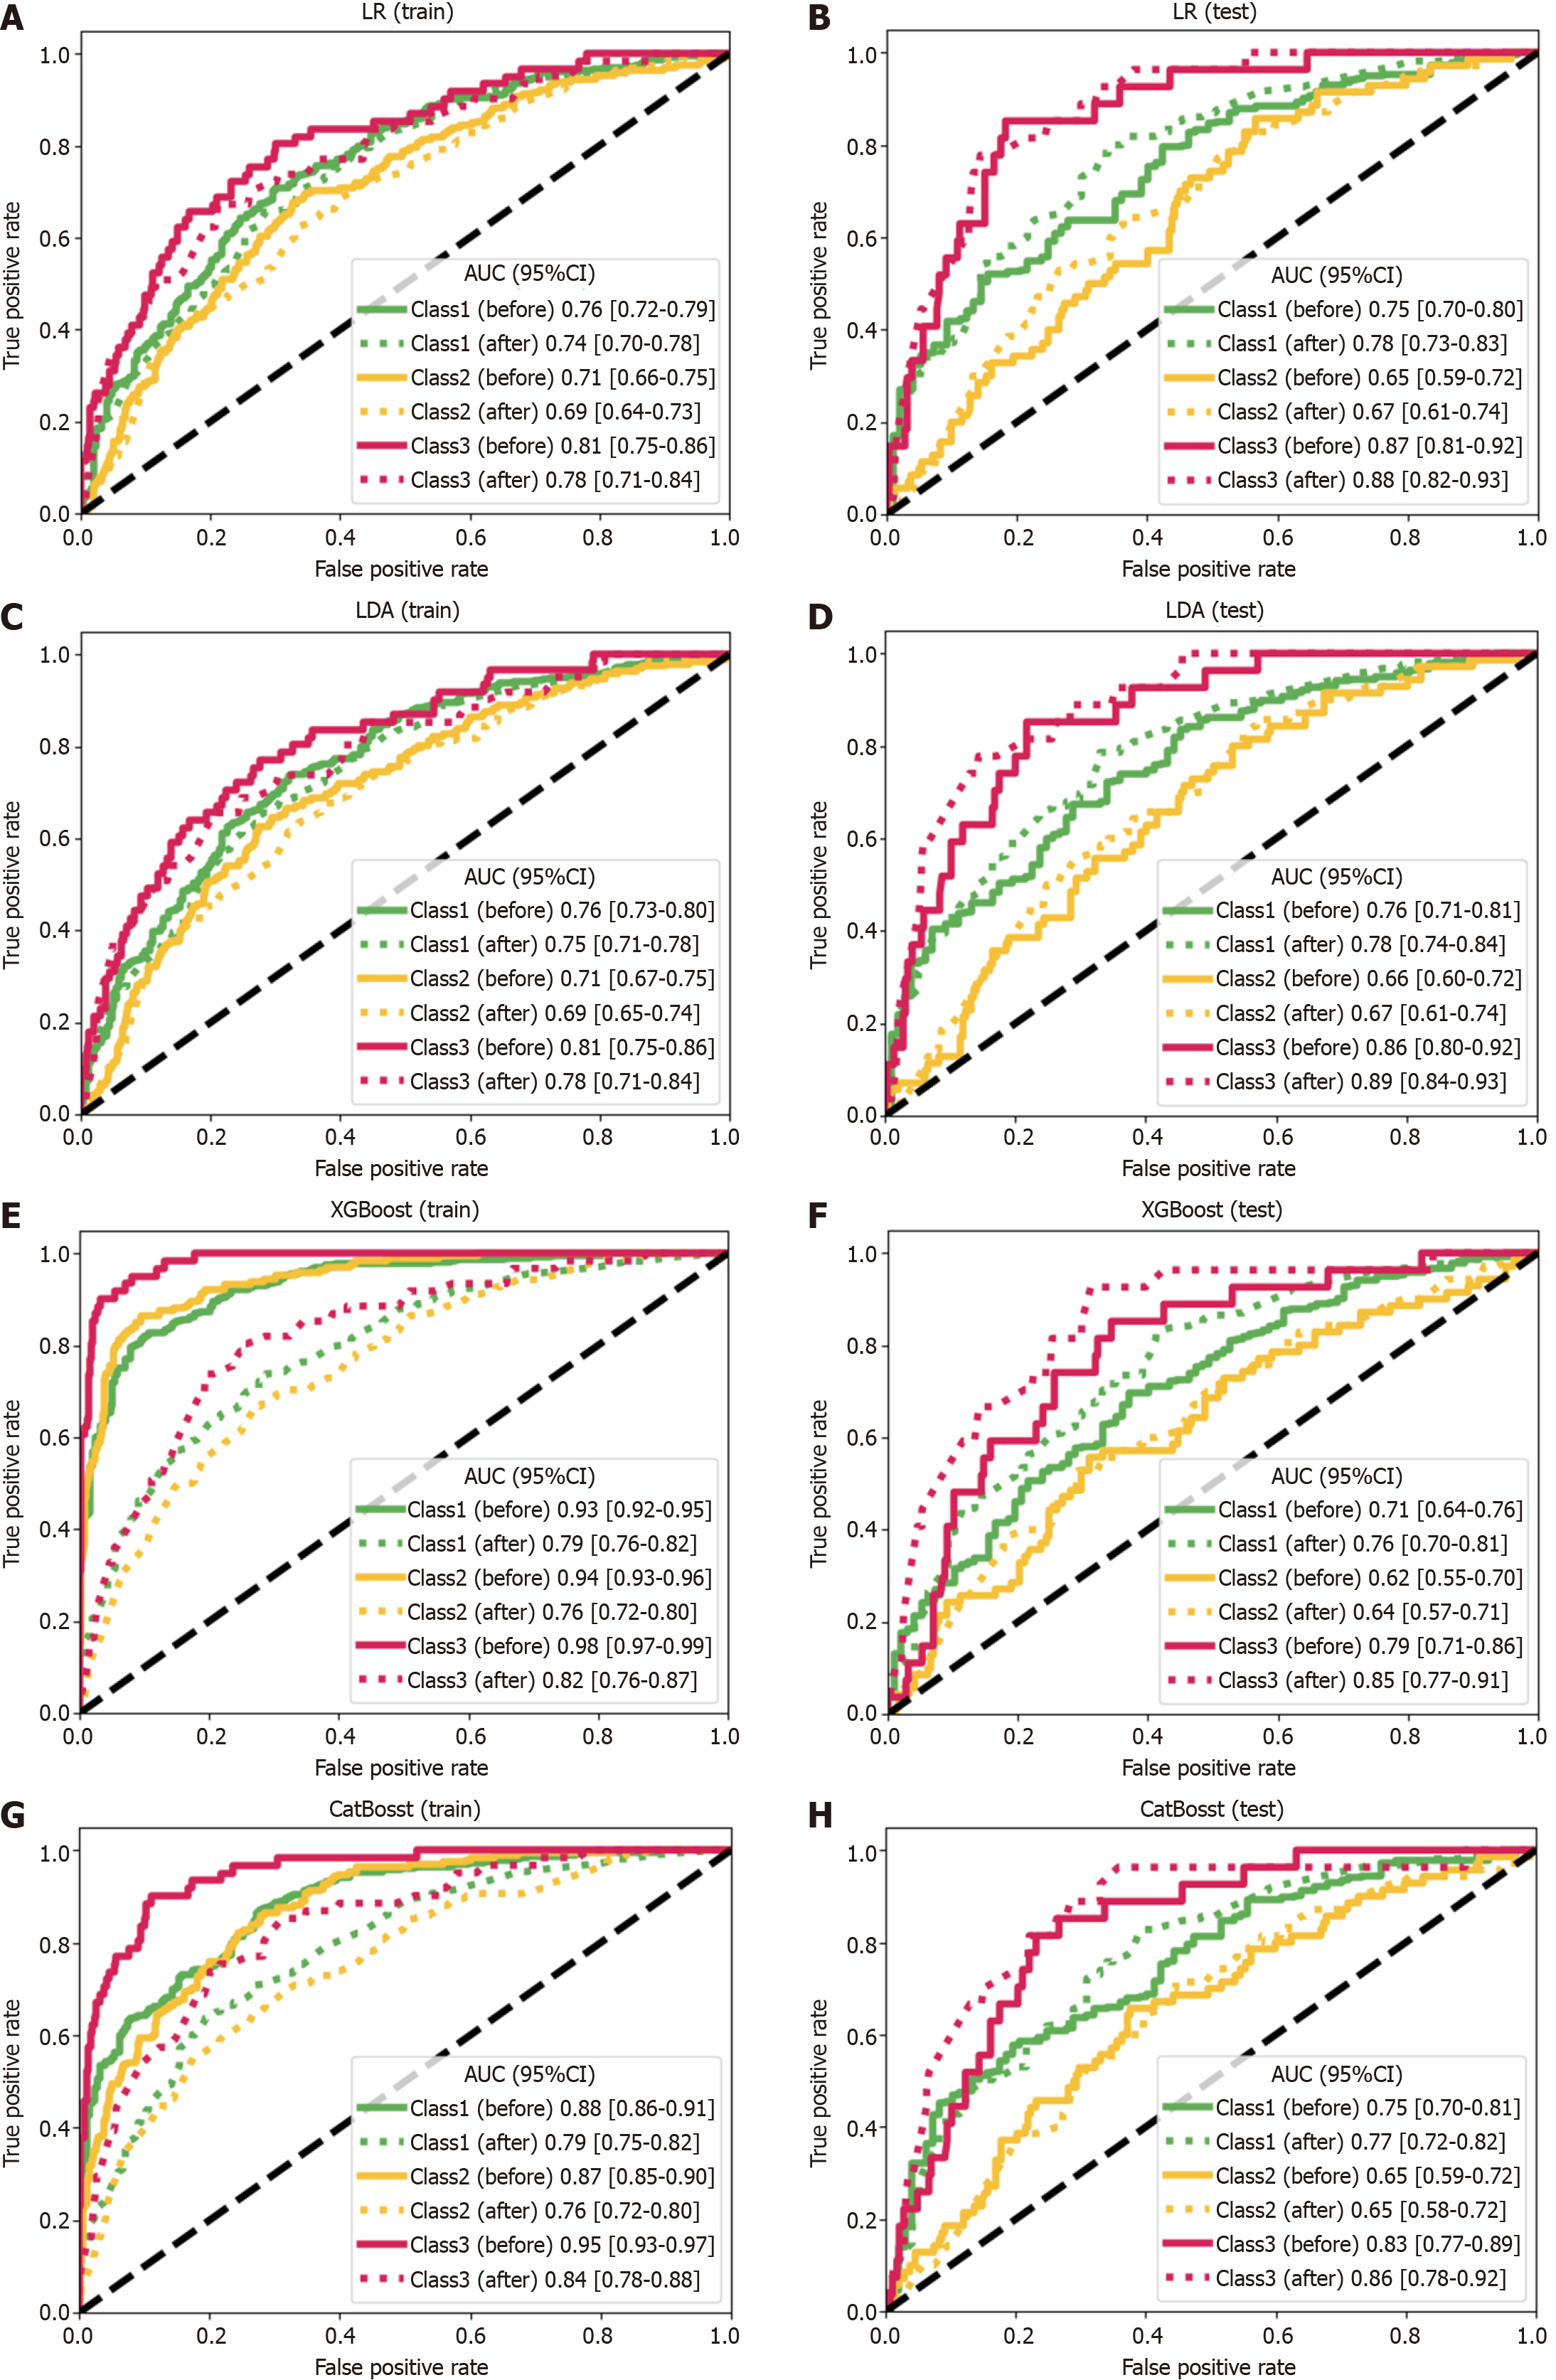
Figure 2 Prediction of overall survival by machine learning models.
The plots show the areas under the curve (AUCs) and their 95% confidence interval (CI). A: The linear regression (LR) in the training set [class 1 (cl 1): Before: 0.76 (0.72-0.79), after: 0.74 (0.70-0.78); class 2 (cl 2): Before: 0.71 (0.66-0.75), after: 0.69 (0.64-0.73); class 3 (cl 3): Before: 0.81 (0.75-0.86), after: 0.78 (0.71-0.84)]; B: The LR model in the testing set [cl 1: Before: 0.75 (0.70-0.80), after: 0.78 (0.73-0.83); cl 2: Before: 0.65 (0.59-0.72), after: 0.67 (0.61-0.74); cl 3: Before: 0.87 (0.81-0.92), after: 0.88 (0.82-0.93)]; C: The linear discriminant analysis (LDA) model in the training set [cl 1: Before: 0.76 (0.73-0.80), after: 0.75 (0.71-0.78); cl 2: Before: 0.71 (0.67-0.75), after: 0.69 (0.65-0.74); cl 3: Before: 0.81 (0.75-0.86), after: 0.78 (0.71-0.84)]; D: The LDA model in the testing set [cl 1: Before: 0.76 (0.71-0.81), after: 0.78 (0.74-0.84); cl 2: Before: 0.66 (0.60-0.72), after: 0.67 (0.61-0.74); cl 3: Before: 0.86 (0.80-0.92), after: 0.89 (0.84-0.93)]; E: The eXtreme gradient boosting (XGBoost) model in the training set [cl 1: Before: 0.93 (0.92-0.95), after: 0.79 (0.76-0.82); cl 2: Before: 0.94 (0.93-0.96), after: 0.76 (0.72-0.80); cl 3: Before: 0.98 (0.97-0.99), after: 0.82 (0.76-0.87)]; F: The XGBoost model in the testing set [cl 1: Before: 0.71 (0.64-0.76), after: 0.76 (0.70-0.81); cl 2: Before: 0.62 (0.55-0.70), after: 0.64 (0.57-0.71); cl 3: Before: 0.79 (0.71-0.86), after: 0.85 (0.77-0.91)]; G: The categorical features and gradient boosting (CatBoost) model in the training set [cl 1: Before: 0.88 (0.86-0.91), after: 0.79 (0.75-0.82); cl 2: Before: 0.87 (0.85-0.90), after: 0.76 (0.72-0.80); cl 3: Before: 0.95 (0.93-0.97), after: 0.84 (0.78-0.88)]; H: The CatBoost model in the testing set [cl 1: Before: 0.75 (0.70-0.81), after: 0.77 (0.72-0.82); cl 2: Before: 0.65 (0.59-0.72), after: 0.65 (0.58-0.72); cl 3: Before: 0.83 (0.77-0.89), after: 0.86 (0.78-0.92)]. The curves of the models constructed with the full-variable datasets and the datasets containing only important variables are depicted with solid lines and dashed lines, respectively (abbreviated as “before” and “after” in this annotation).
- Citation: Ji XL, Xu S, Li XY, Xu JH, Han RS, Guo YJ, Duan LP, Tian ZB. Prognostic prediction models for postoperative patients with stage I to III colorectal cancer based on machine learning. World J Gastrointest Oncol 2024; 16(12): 4597-4613
- URL: https://www.wjgnet.com/1948-5204/full/v16/i12/4597.htm
- DOI: https://dx.doi.org/10.4251/wjgo.v16.i12.4597