
















©The Author(s) 2024.
World J Gastrointest Oncol. Oct 15, 2024; 16(10): 4092-4103
Published online Oct 15, 2024. doi: 10.4251/wjgo.v16.i10.4092
Published online Oct 15, 2024. doi: 10.4251/wjgo.v16.i10.4092
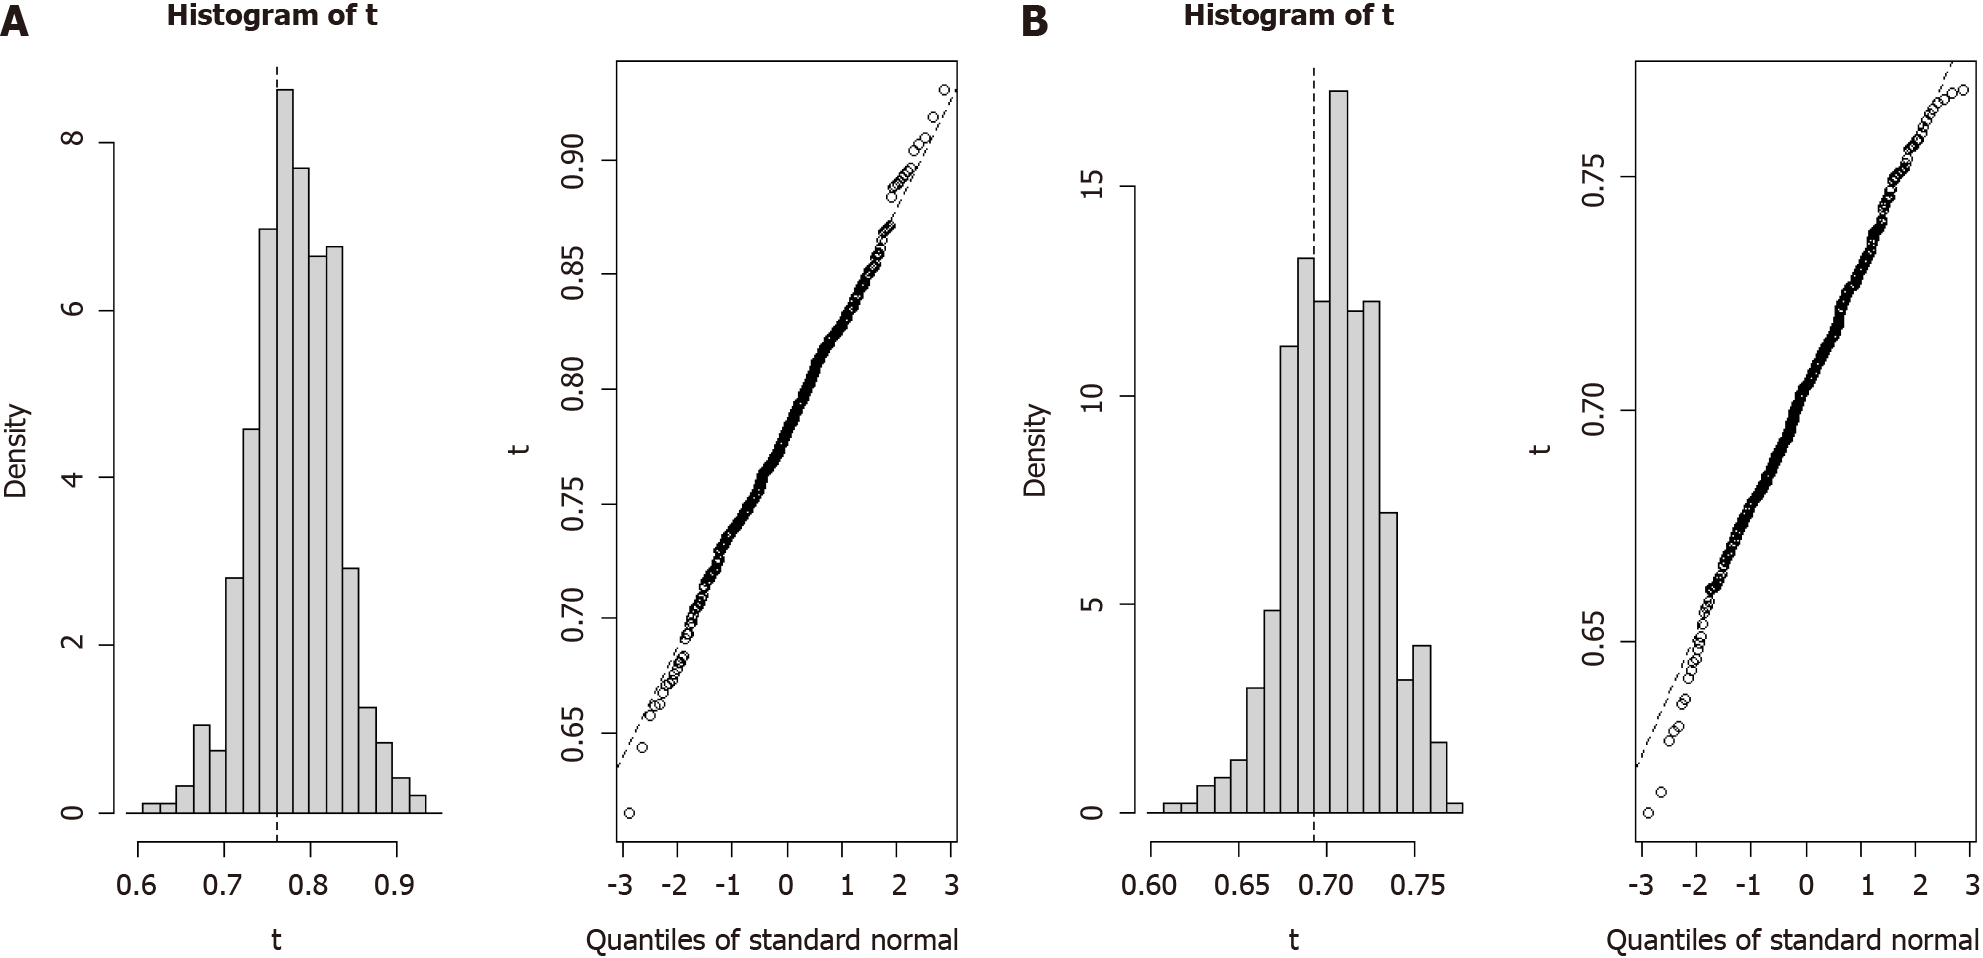
Figure 4 Bootstrap analysis for model efficiency.
A: Histogram of bootstrap validation for the 1-year prognostic model; B: Histogram of bootstrap validation for the 3-year prognostic model. The left image in each panel represents the efficiency obtained from bootstrap validation, while the right image shows the quality standard curve during the validation process.
- Citation: Wang ZR, Zhang CZ, Ding Z, Li YZ, Yin JH, Li N. Establishing prognostic models for intrahepatic cholangiocarcinoma based on immune cells. World J Gastrointest Oncol 2024; 16(10): 4092-4103
- URL: https://www.wjgnet.com/1948-5204/full/v16/i10/4092.htm
- DOI: https://dx.doi.org/10.4251/wjgo.v16.i10.4092