Copyright
©The Author(s) 2023.
World J Gastrointest Oncol. Sep 15, 2023; 15(9): 1605-1615
Published online Sep 15, 2023. doi: 10.4251/wjgo.v15.i9.1605
Published online Sep 15, 2023. doi: 10.4251/wjgo.v15.i9.1605
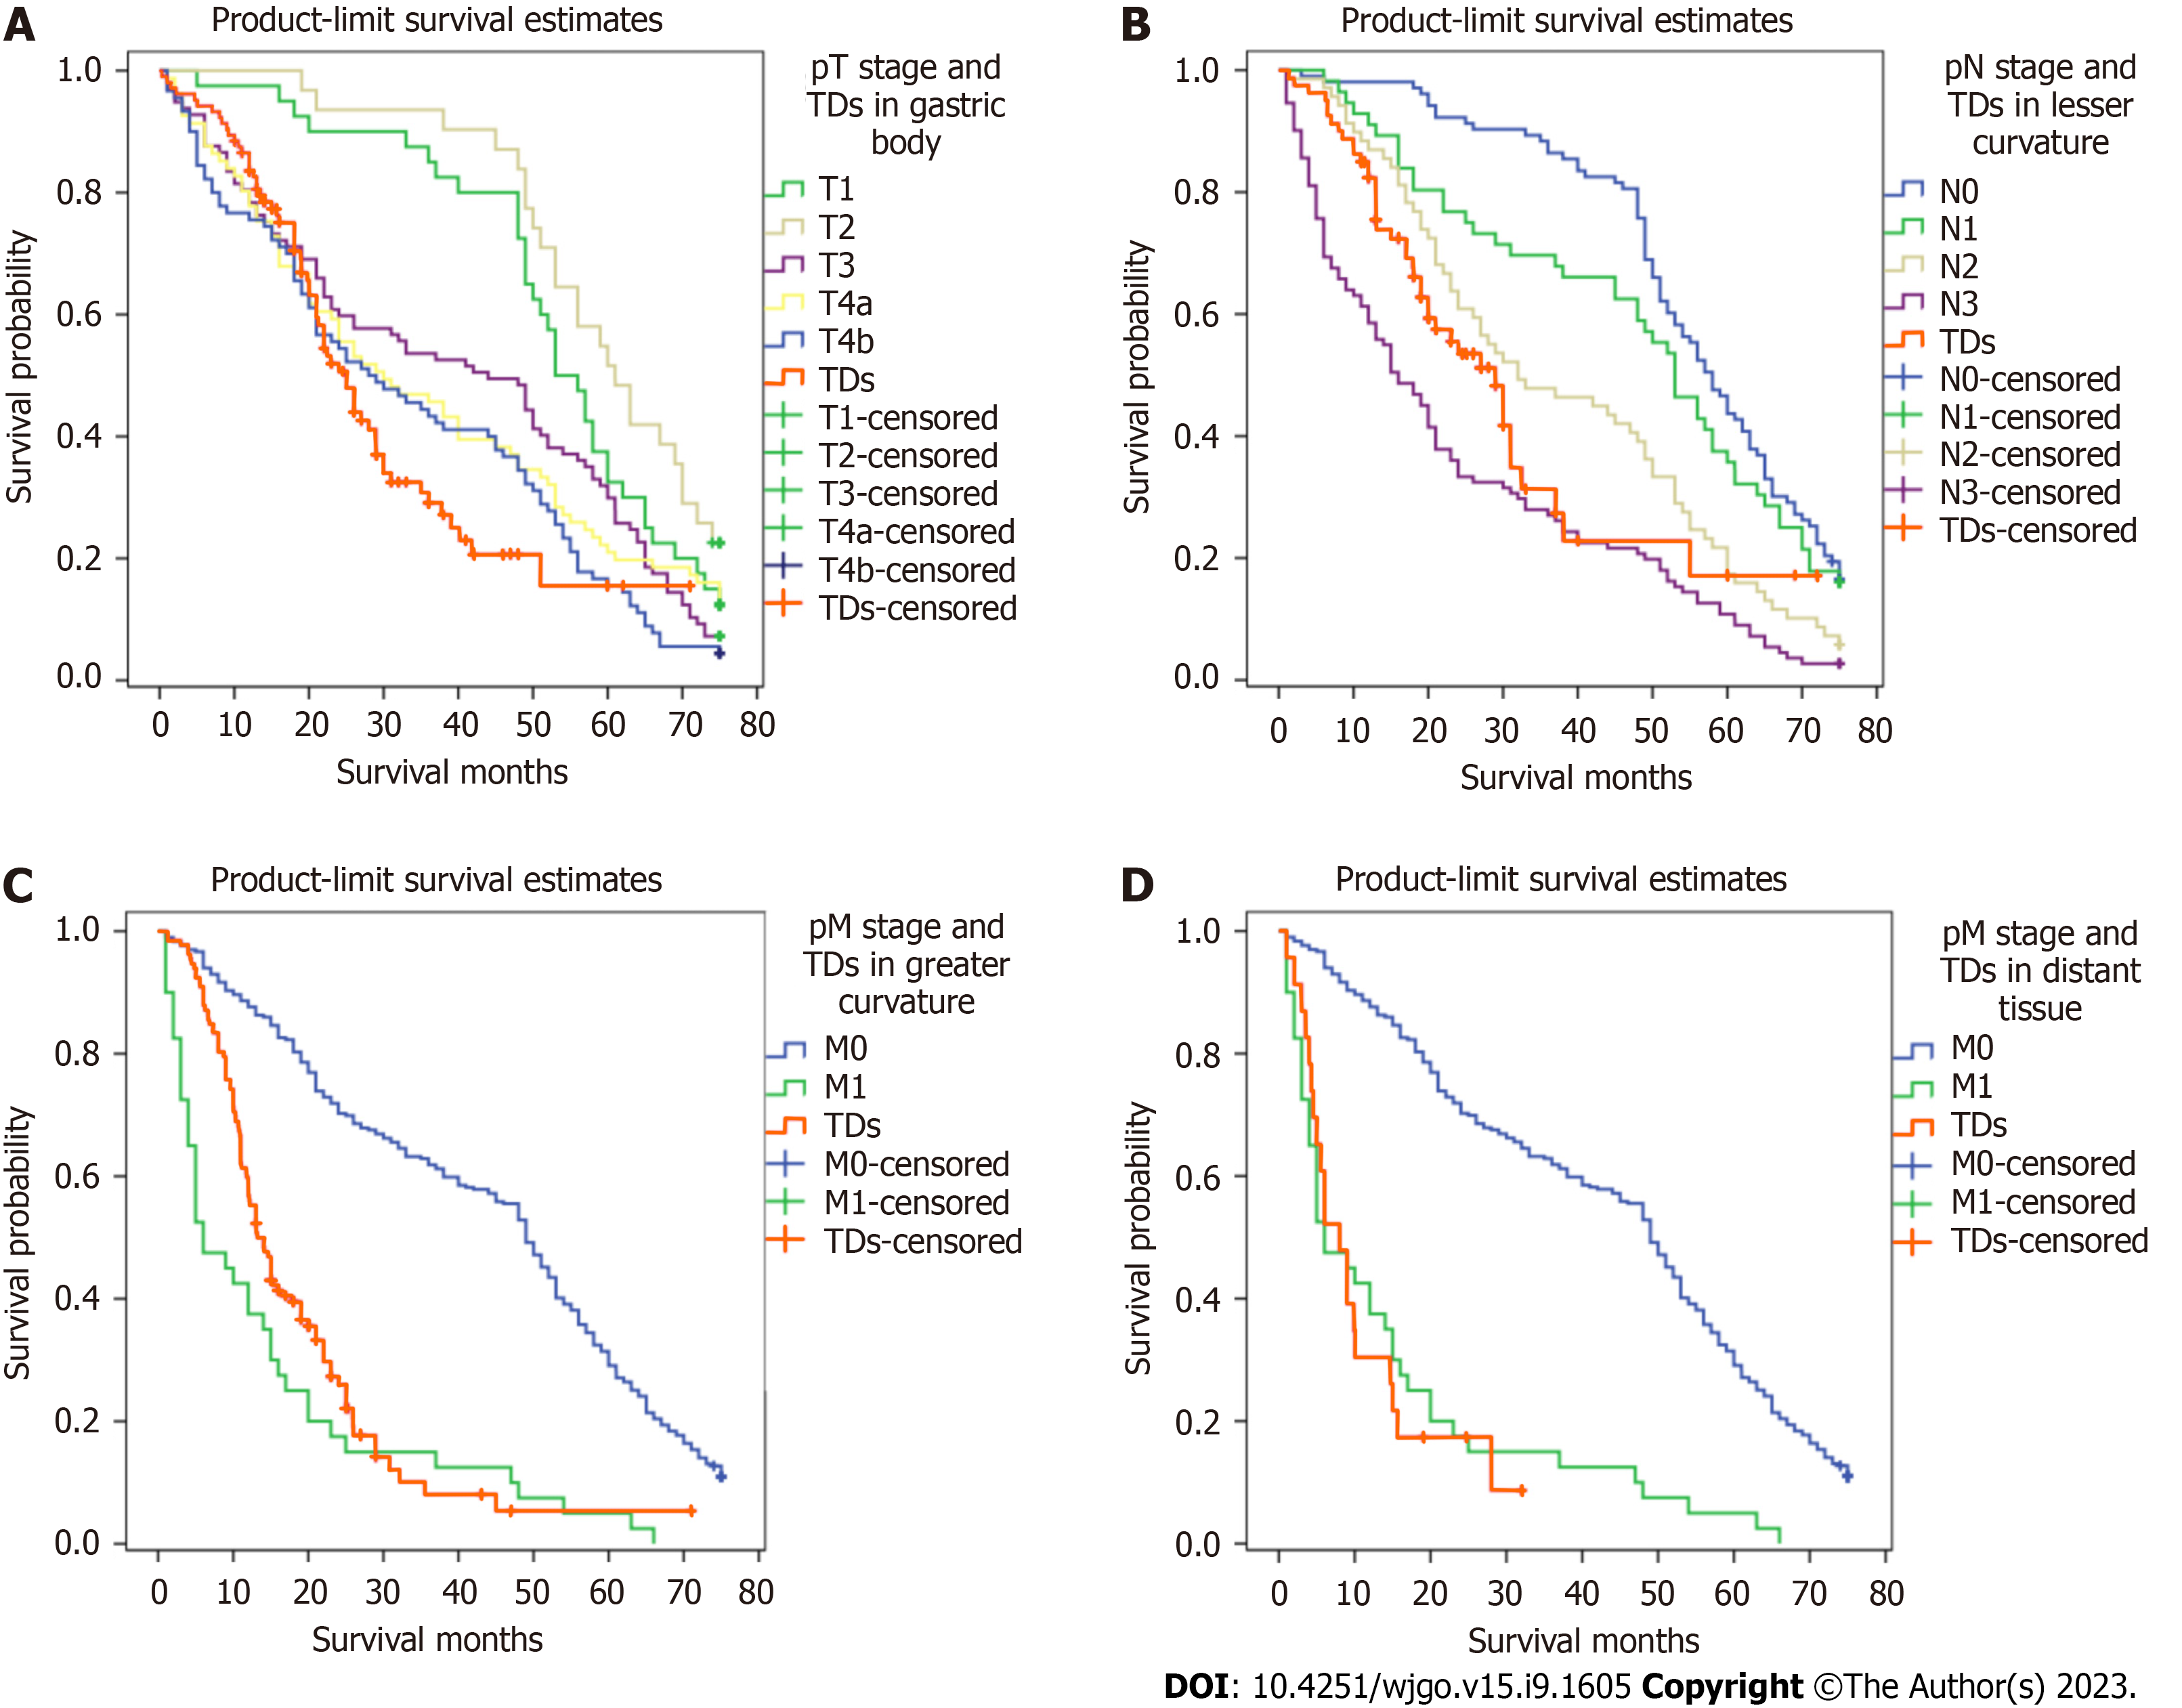
Figure 6 Comparison of survival curves of patients with different tumor deposit locations and with those of patients without tumor deposits with different TNM pathological stages.
A: Comparison of Kaplan-Meier (K-M) curves of patients with tumor deposits (TDs) appearing in the gastric body with pathological stage of T without TDs; B: Comparison of K-M curves of patients with TDs appearing in the lesser curvature with pathological stage of N without TDs; C: Comparison of K-M curves of patients with TDs appearing in the greater curvature with pathological stage of M (pM) without TDs; D: Comparison of K-M curves of patients with TDs appearing in distant tissue with pM without TDs. TDs: Tumor deposits; pT: Pathological stage of T; pN: Pathological stage of N; pM: Pathological stage of M.
- Citation: Li Y, Li S, Liu L, Zhang LY, Wu D, Xie TY, Wang XX. Incorporation of perigastric tumor deposits into the TNM staging system for primary gastric cancer. World J Gastrointest Oncol 2023; 15(9): 1605-1615
- URL: https://www.wjgnet.com/1948-5204/full/v15/i9/1605.htm
- DOI: https://dx.doi.org/10.4251/wjgo.v15.i9.1605


