Copyright
©The Author(s) 2023.
World J Gastrointest Oncol. Sep 15, 2023; 15(9): 1567-1594
Published online Sep 15, 2023. doi: 10.4251/wjgo.v15.i9.1567
Published online Sep 15, 2023. doi: 10.4251/wjgo.v15.i9.1567
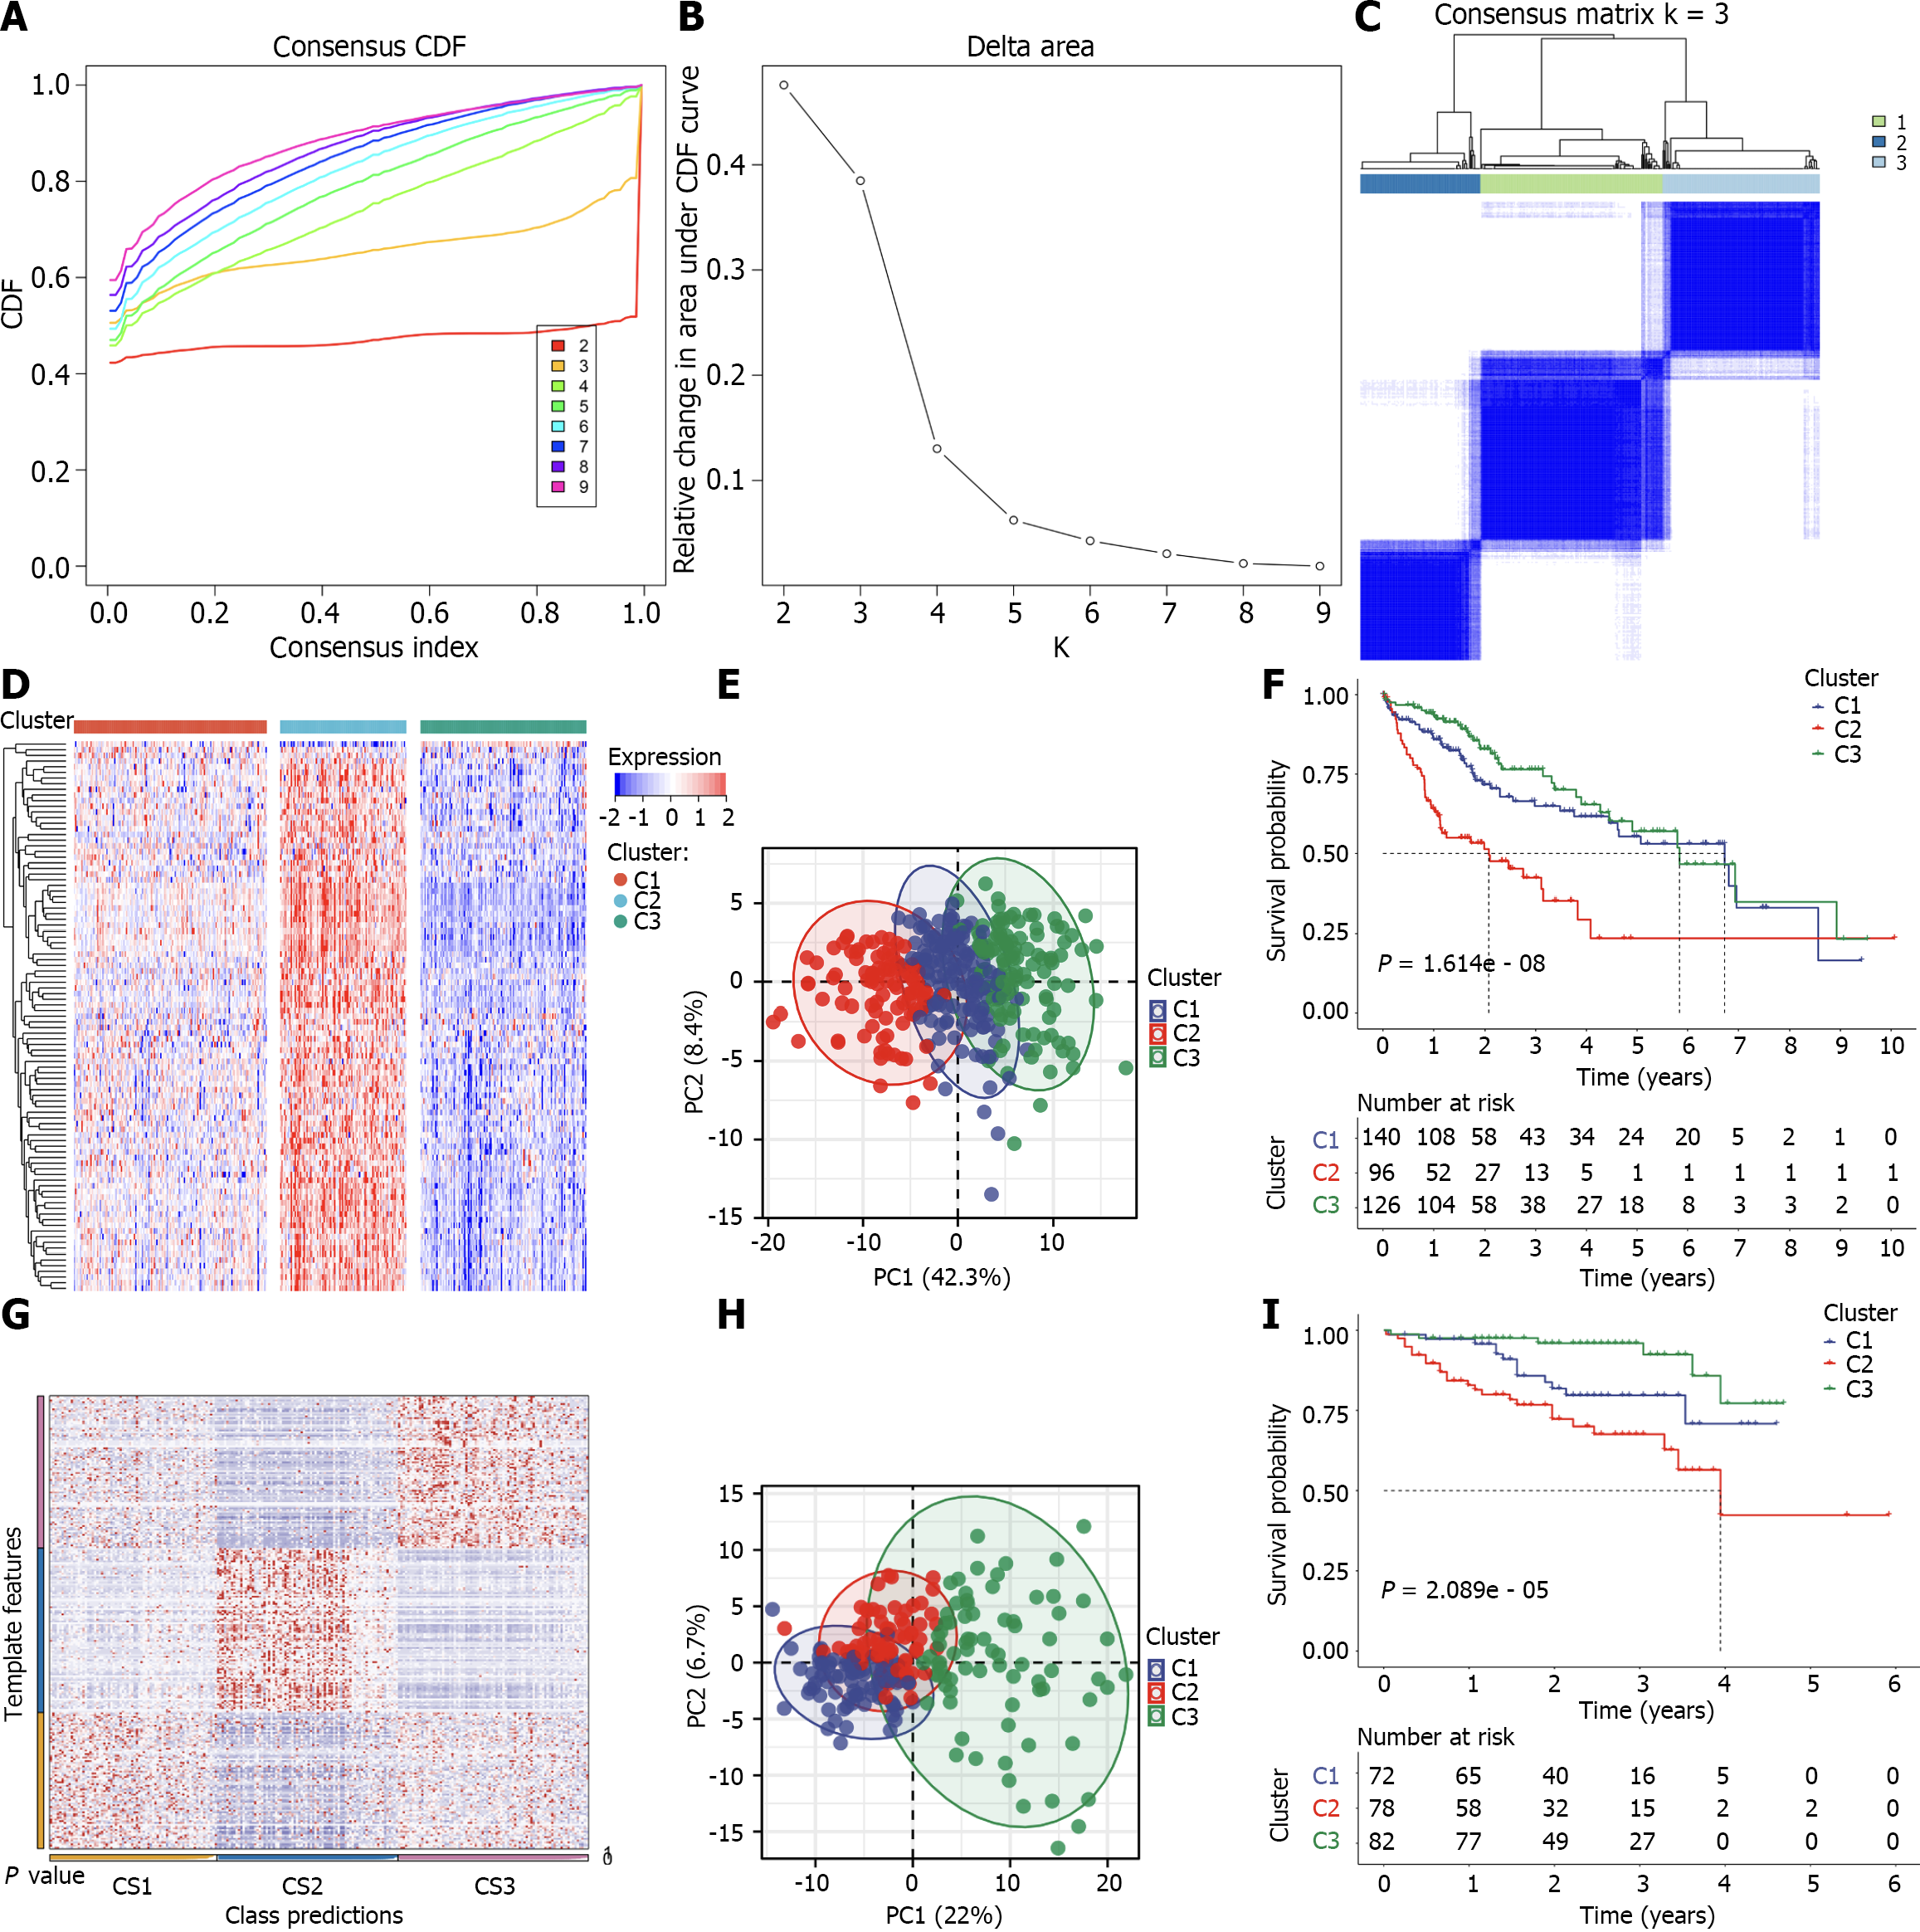
Figure 2 Classification of TCGA-LIHC patients as three cellular senescence subtypes and external dataset validation.
A–C: Consensus cumulative distribution function (CDF), relative alteration in area under CDF curve, and consensus matrix k = 3 based upon the transcriptome of prognostic differentially expressed cellular senescence genes across TCGA-LIHC patients; D: The transcript levels of differentially expressed cellular senescence genes with prognostic implications across three subtypes; E: Principal component analysis (PCA) plots of the discrepancy in transcript levels among subtypes; F: Kaplan–Meier (K-M) curves of overall survival in TCGA-LIHC; G: Nearest template prediction for verifying the subtypes in the International Cancer Genome Consortium (ICGC) cohort; H and I: PCA plots of the transcriptome difference and K-M curves of overall survival among subtypes in the ICGC cohort.
- Citation: Wang HH, Chen WL, Cui YY, Gong HH, Li H. Cellular senescence throws new insights into patient classification and pharmacological interventions for clinical management of hepatocellular carcinoma. World J Gastrointest Oncol 2023; 15(9): 1567-1594
- URL: https://www.wjgnet.com/1948-5204/full/v15/i9/1567.htm
- DOI: https://dx.doi.org/10.4251/wjgo.v15.i9.1567


