Copyright
©The Author(s) 2023.
World J Gastrointest Oncol. Aug 15, 2023; 15(8): 1349-1365
Published online Aug 15, 2023. doi: 10.4251/wjgo.v15.i8.1349
Published online Aug 15, 2023. doi: 10.4251/wjgo.v15.i8.1349
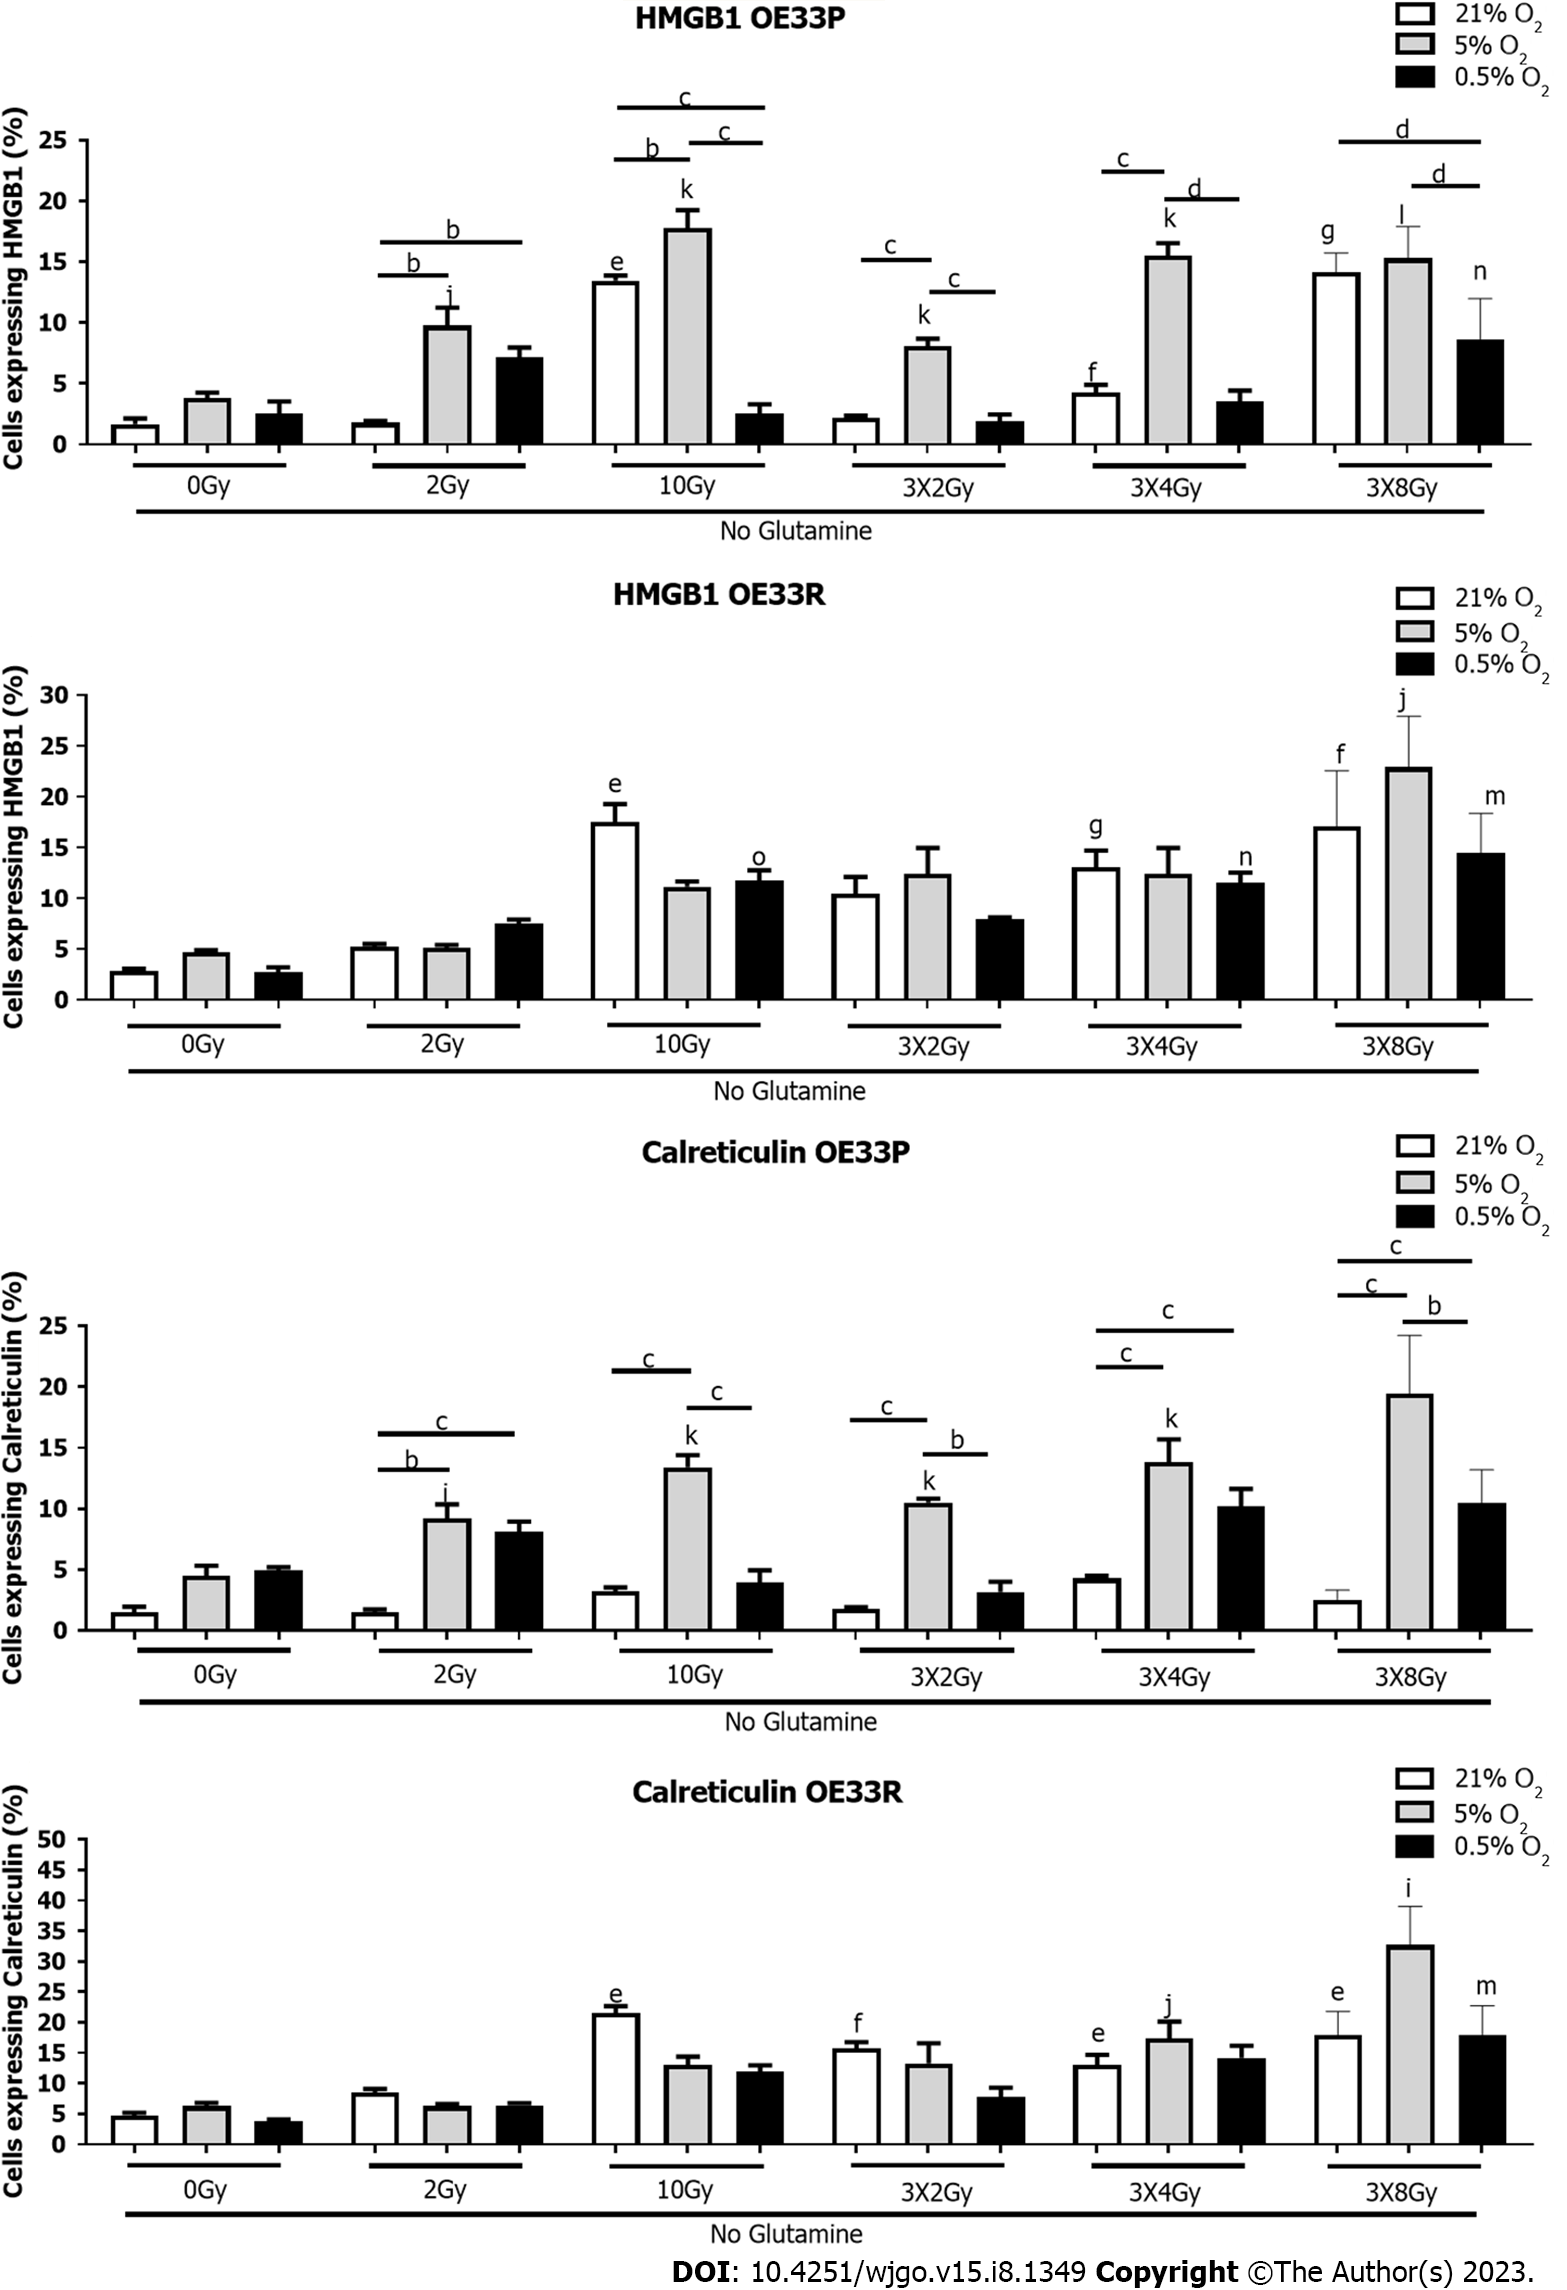
Figure 4 HMGB1 and calreticulin are expressed at a higher level under 5% oxygenation no glutamine in the OE33P cell line.
OE33P and OE33R cell lines were screened for the surface expression of HMGB1 and calreticulin following culture in glutamine depleted media by flow cytometry. 21% = normal oxygenation, 5% = mild hypoxia, 0.5% = severe hypoxia. Bolus dosing was administered once daily over three consecutive days. Staining of cancer cells took place 24hrs after last fraction of radiation. Tukey’s multiple comparison testing. Graph shows mean % expression (± SEM) (n = 3). aP < 0.05, bP < 0.01, cP < 0.001, dP < 0.0001 vs oxygen levels for each radiation dosing regimen; eP < 0.05, fP < 0.01, gP < 0.001 vs dosing with 0 Gy at 21% O2; iP < 0.05, jP < 0.01, kP < 0.001 vs dosing with 0 Gy at 5% O2; lP < 0.05, mP < 0.01, nP < 0.001 vs dosing with 0 Gy at 0.5% O2.
- Citation: Donlon NE, Davern M, Sheppard A, O'Connell F, Moran B, Nugent TS, Heeran A, Phelan JJ, Bhardwaj A, Butler C, Ravi N, Donohoe CL, Lynam-Lennon N, Maher S, Reynolds JV, Lysaght J. Potential of damage associated molecular patterns in synergising radiation and the immune response in oesophageal cancer. World J Gastrointest Oncol 2023; 15(8): 1349-1365
- URL: https://www.wjgnet.com/1948-5204/full/v15/i8/1349.htm
- DOI: https://dx.doi.org/10.4251/wjgo.v15.i8.1349


