Copyright
©The Author(s) 2023.
World J Gastrointest Oncol. Mar 15, 2023; 15(3): 546-561
Published online Mar 15, 2023. doi: 10.4251/wjgo.v15.i3.546
Published online Mar 15, 2023. doi: 10.4251/wjgo.v15.i3.546
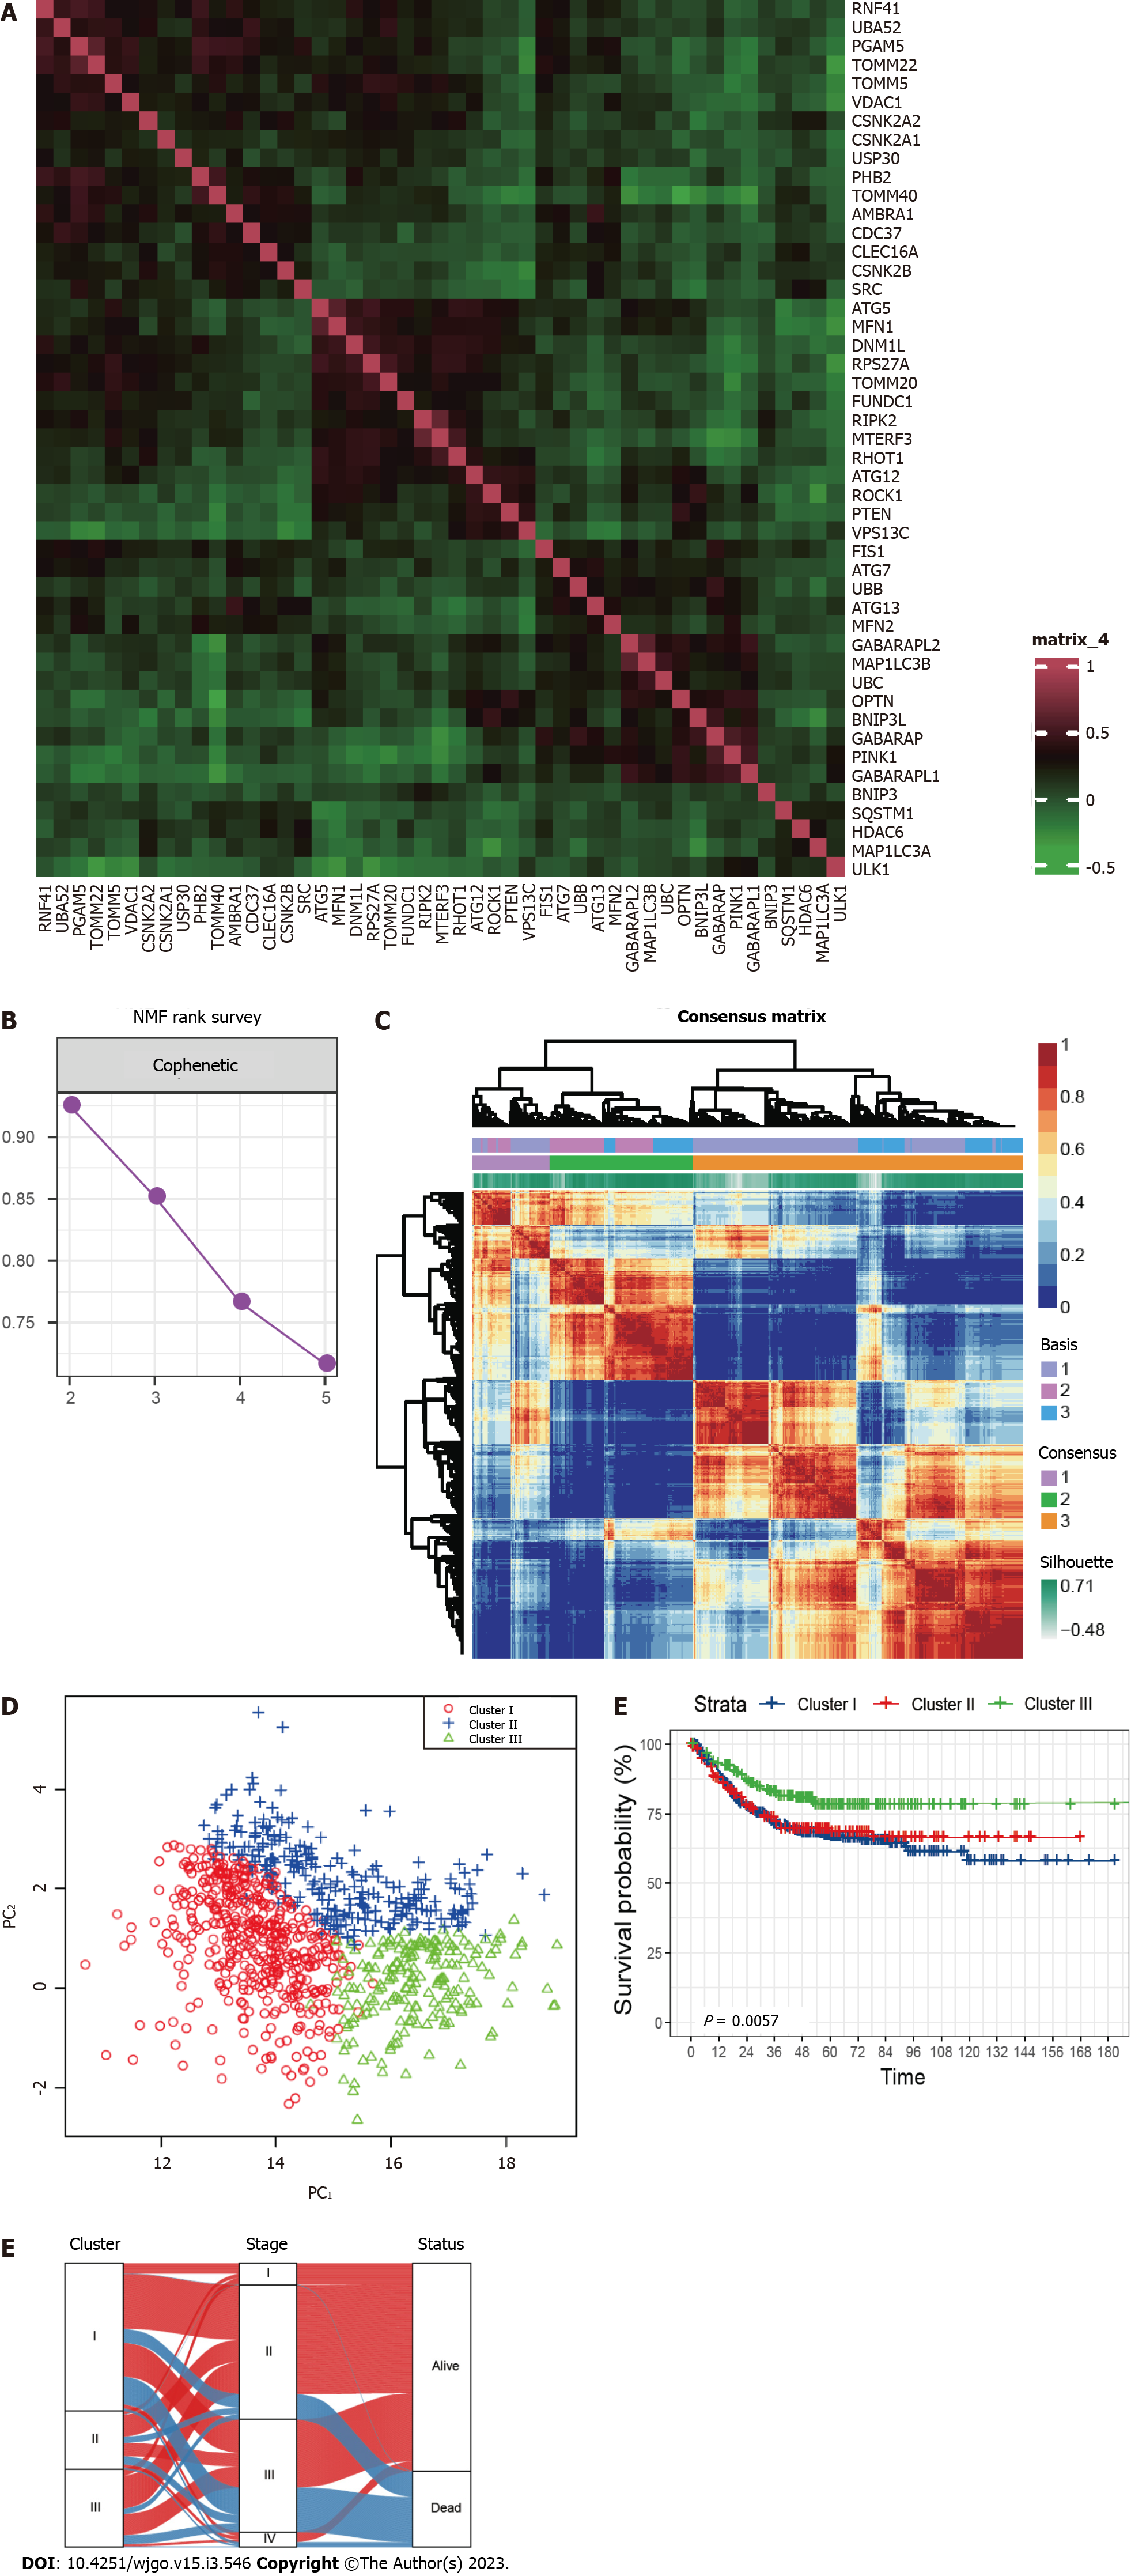
Figure 1 Grouping of mitophagy-related clusters in colorectal cancer.
A: Expression correlation among mitophagy-related genes; B: The cophenetic plot of NMF clustering analyses; C: Heatmap showing three clusters were identified, along with the optimal value for consensus clustering; D: Principal component analysis of three mitophagy-related clusters; E: Kaplan-Meier curves for survival rate of three clusters showing patients in cluster III have the best prognosis (P = 0.0057). The P value was calculated using the log-rank test; F: Alluvial diagram of clusters shows patients in cluster III tend to be early-stage. NMF: Nonnegative Matrix Factorization.
- Citation: Weng JS, Huang JP, Yu W, Xiao J, Lin F, Lin KN, Zang WD, Ye Y, Lin JP. Mitophagy-related gene signature predicts prognosis, immune infiltration and chemotherapy sensitivity in colorectal cancer. World J Gastrointest Oncol 2023; 15(3): 546-561
- URL: https://www.wjgnet.com/1948-5204/full/v15/i3/546.htm
- DOI: https://dx.doi.org/10.4251/wjgo.v15.i3.546


