Copyright
©The Author(s) 2023.
World J Gastrointest Oncol. Mar 15, 2023; 15(3): 372-388
Published online Mar 15, 2023. doi: 10.4251/wjgo.v15.i3.372
Published online Mar 15, 2023. doi: 10.4251/wjgo.v15.i3.372
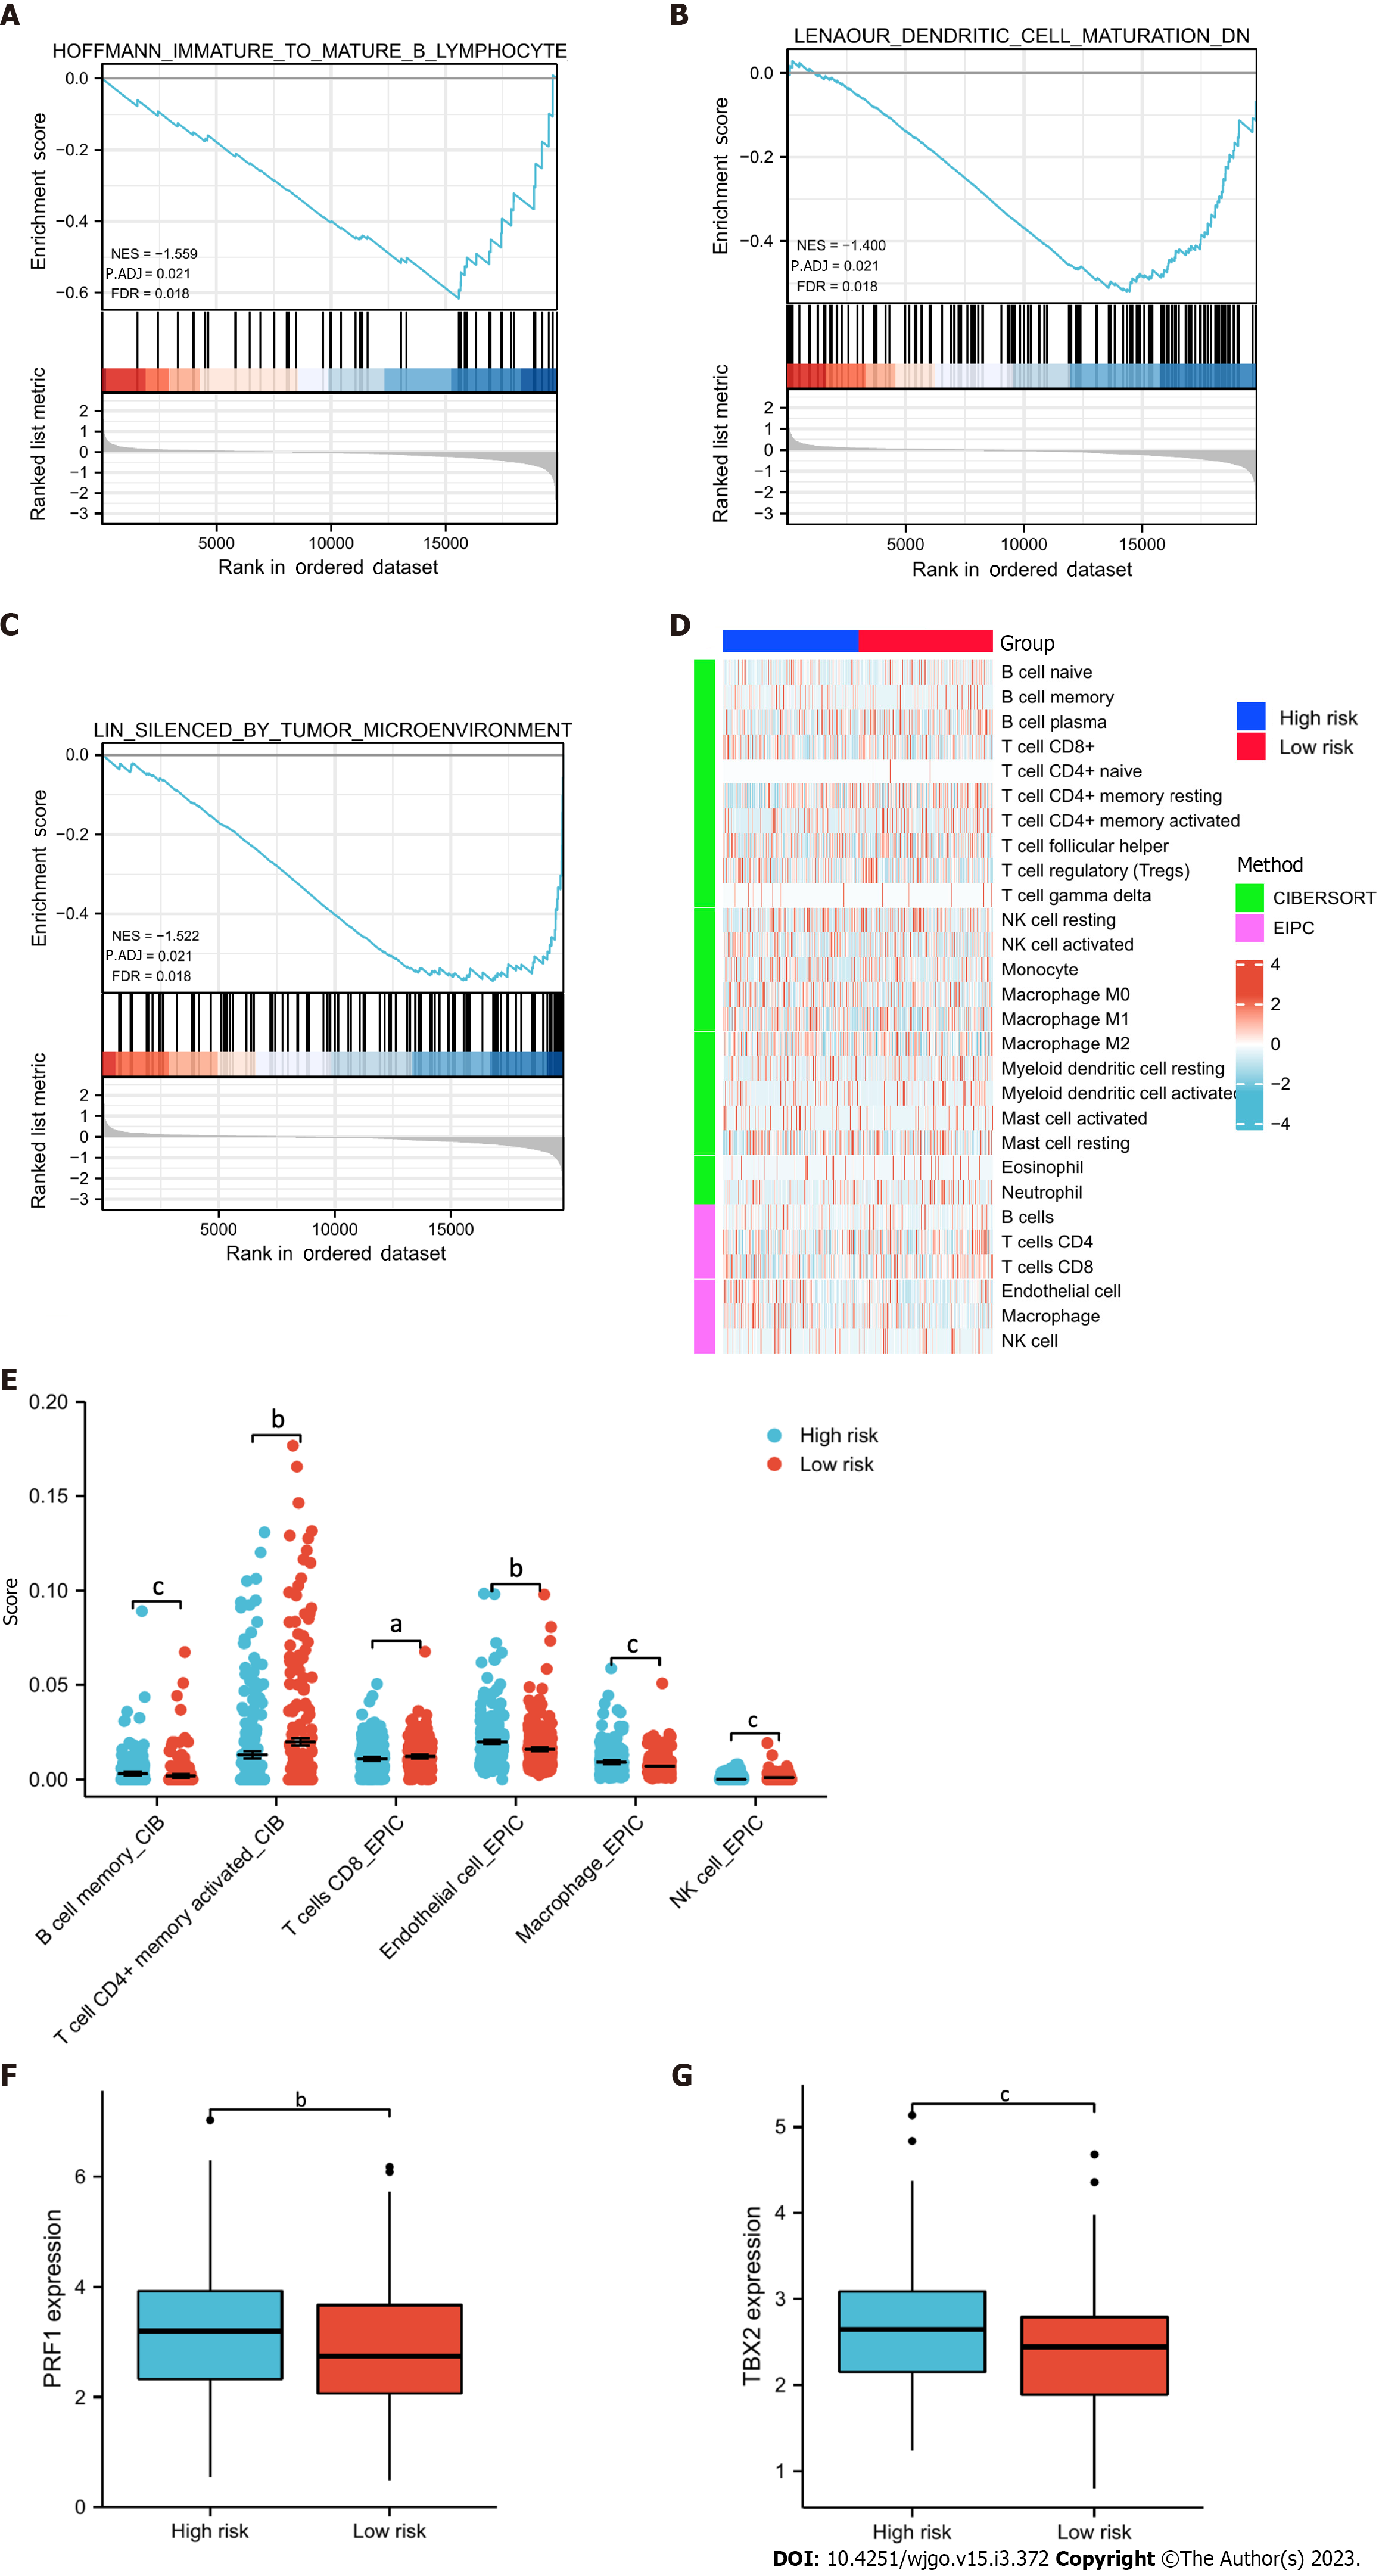
Figure 7 Functional enrichment and immune profiling.
A-C: Gene set enrichment analysis functional enrichment results of differentially expressed genes in the high- and low-risk groups; D: Heatmap showing the infiltrating abundance of different immune cells in different groups analyzed by CIBERSORT and EPIC algorithms; E: Significant (P < 0.05) results presented in immune infiltration analysis; F and G: Differential expression of genes related to immune checkpoint inhibitors in the high- and low-risk groups. Both were highly expressed in the high-risk group. aP < 0.05; bP < 0.01; cP < 0.001.
- Citation: Huang YY, Bao TY, Huang XQ, Lan QW, Huang ZM, Chen YH, Hu ZD, Guo XG. Machine learning algorithm to construct cuproptosis- and immune-related prognosis prediction model for colon cancer. World J Gastrointest Oncol 2023; 15(3): 372-388
- URL: https://www.wjgnet.com/1948-5204/full/v15/i3/372.htm
- DOI: https://dx.doi.org/10.4251/wjgo.v15.i3.372


