Copyright
©The Author(s) 2023.
World J Gastrointest Oncol. Mar 15, 2023; 15(3): 372-388
Published online Mar 15, 2023. doi: 10.4251/wjgo.v15.i3.372
Published online Mar 15, 2023. doi: 10.4251/wjgo.v15.i3.372
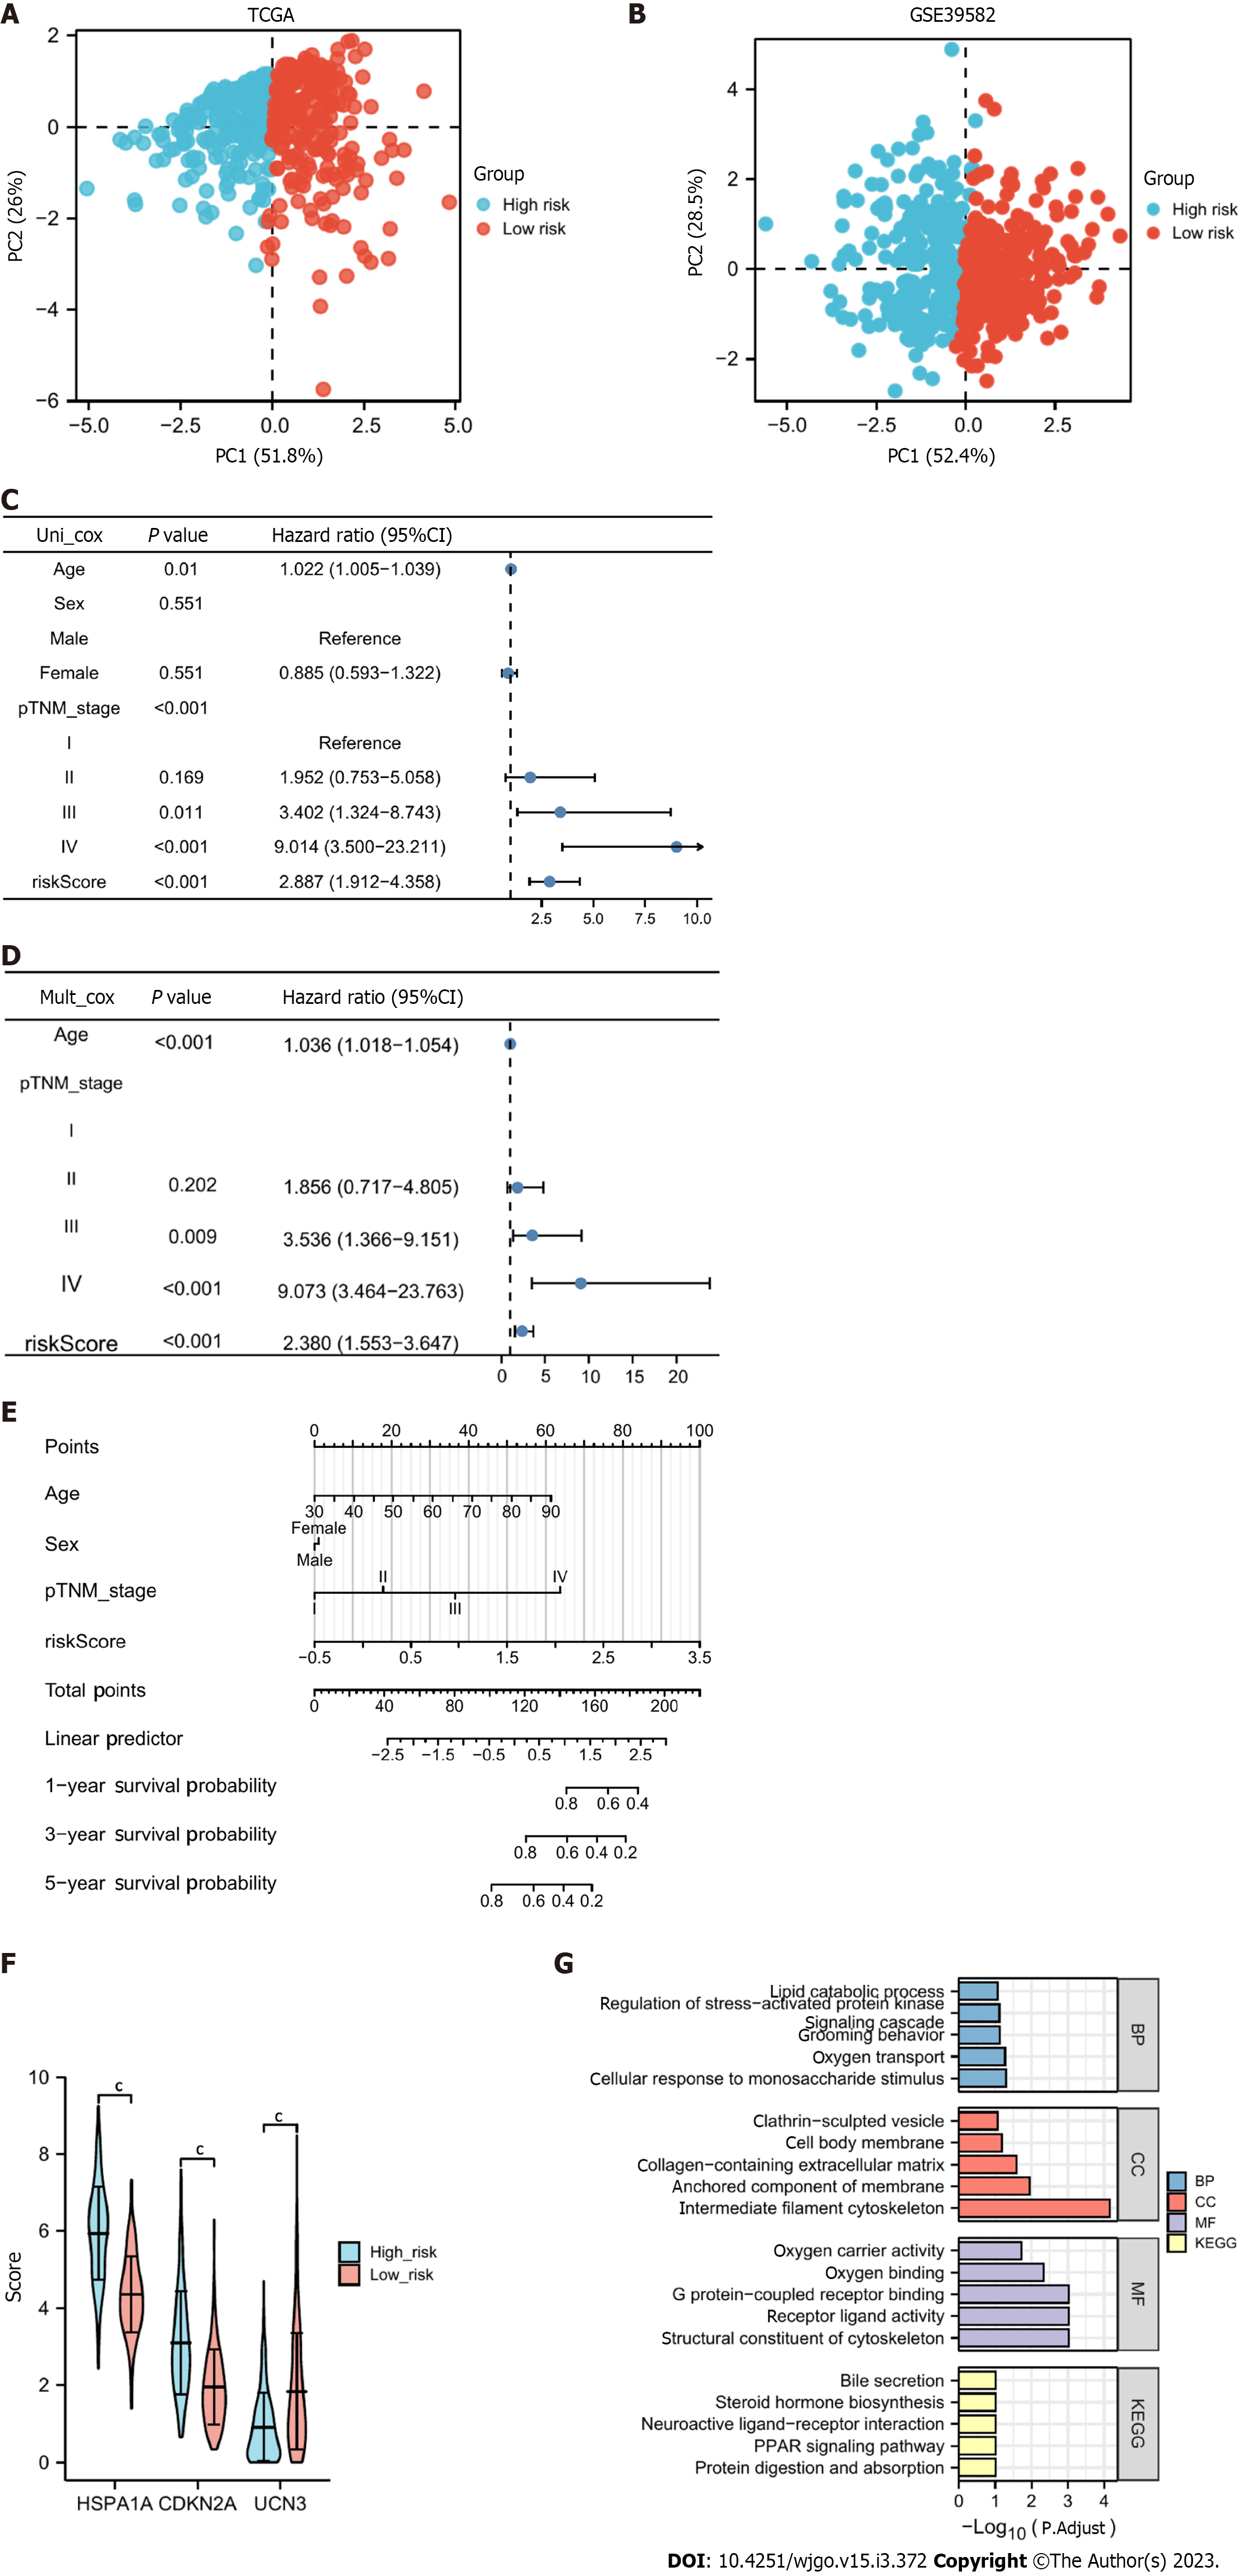
Figure 6 Principal component analysis and the independent predictive value of the risk score.
A and B: The principal component analysis plots in The Cancer Genome Atlas (TCGA) and Gene Expression Omnibus, respectively, and both high- and low-risk groups can be obviously distinguished; C and D: Univariate and multivariate Cox regression analyses of the cuproptosis- and immune-related risk score and other clinical features to screen for factors independently associated with prognosis; E: A nomogram helps predict a patient’s prognosis based on the patient’s information; F: Differential expression of CDKN2A, HSPA1A, and UCN3 in the high- and low-risk groups; G: Functional enrichment consequences of differentially expressed genes in the high- and low-risk groups. cP < 0.001.
- Citation: Huang YY, Bao TY, Huang XQ, Lan QW, Huang ZM, Chen YH, Hu ZD, Guo XG. Machine learning algorithm to construct cuproptosis- and immune-related prognosis prediction model for colon cancer. World J Gastrointest Oncol 2023; 15(3): 372-388
- URL: https://www.wjgnet.com/1948-5204/full/v15/i3/372.htm
- DOI: https://dx.doi.org/10.4251/wjgo.v15.i3.372


