Copyright
©The Author(s) 2023.
World J Gastrointest Oncol. Jan 15, 2023; 15(1): 112-127
Published online Jan 15, 2023. doi: 10.4251/wjgo.v15.i1.112
Published online Jan 15, 2023. doi: 10.4251/wjgo.v15.i1.112
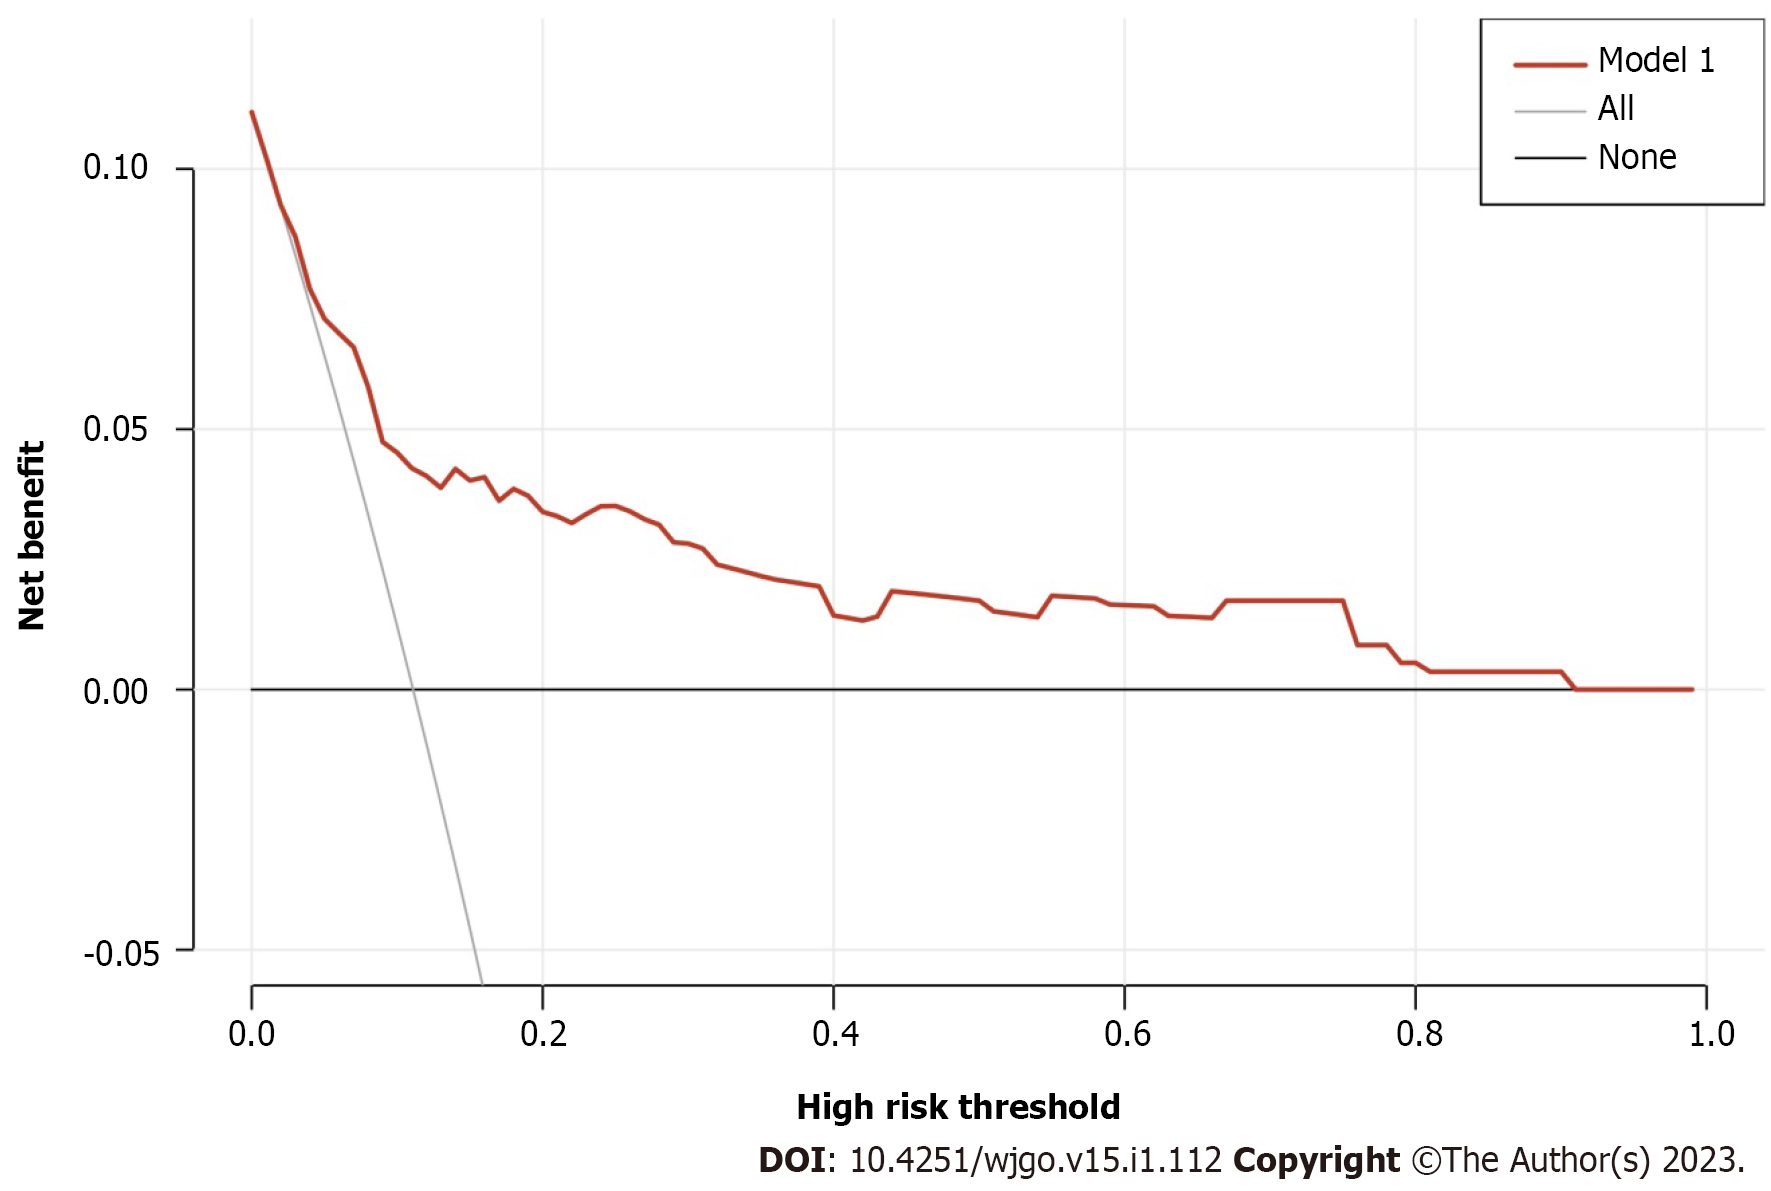
Figure 6 Decision curve analysis for the metachronous peritoneal metastasis nomogram.
The blue line represents this nomogram. When the threshold probability is between 1% and 90%, using this nomogram to predict metachronous peritoneal metastasis can achieve net benefit. m-PM: Metachronous peritoneal metastasis.
- Citation: Ban B, Shang A, Shi J. Development and validation of a nomogram for predicting metachronous peritoneal metastasis in colorectal cancer: A retrospective study. World J Gastrointest Oncol 2023; 15(1): 112-127
- URL: https://www.wjgnet.com/1948-5204/full/v15/i1/112.htm
- DOI: https://dx.doi.org/10.4251/wjgo.v15.i1.112


