Copyright
©The Author(s) 2022.
World J Gastrointest Oncol. Mar 15, 2022; 14(3): 703-715
Published online Mar 15, 2022. doi: 10.4251/wjgo.v14.i3.703
Published online Mar 15, 2022. doi: 10.4251/wjgo.v14.i3.703
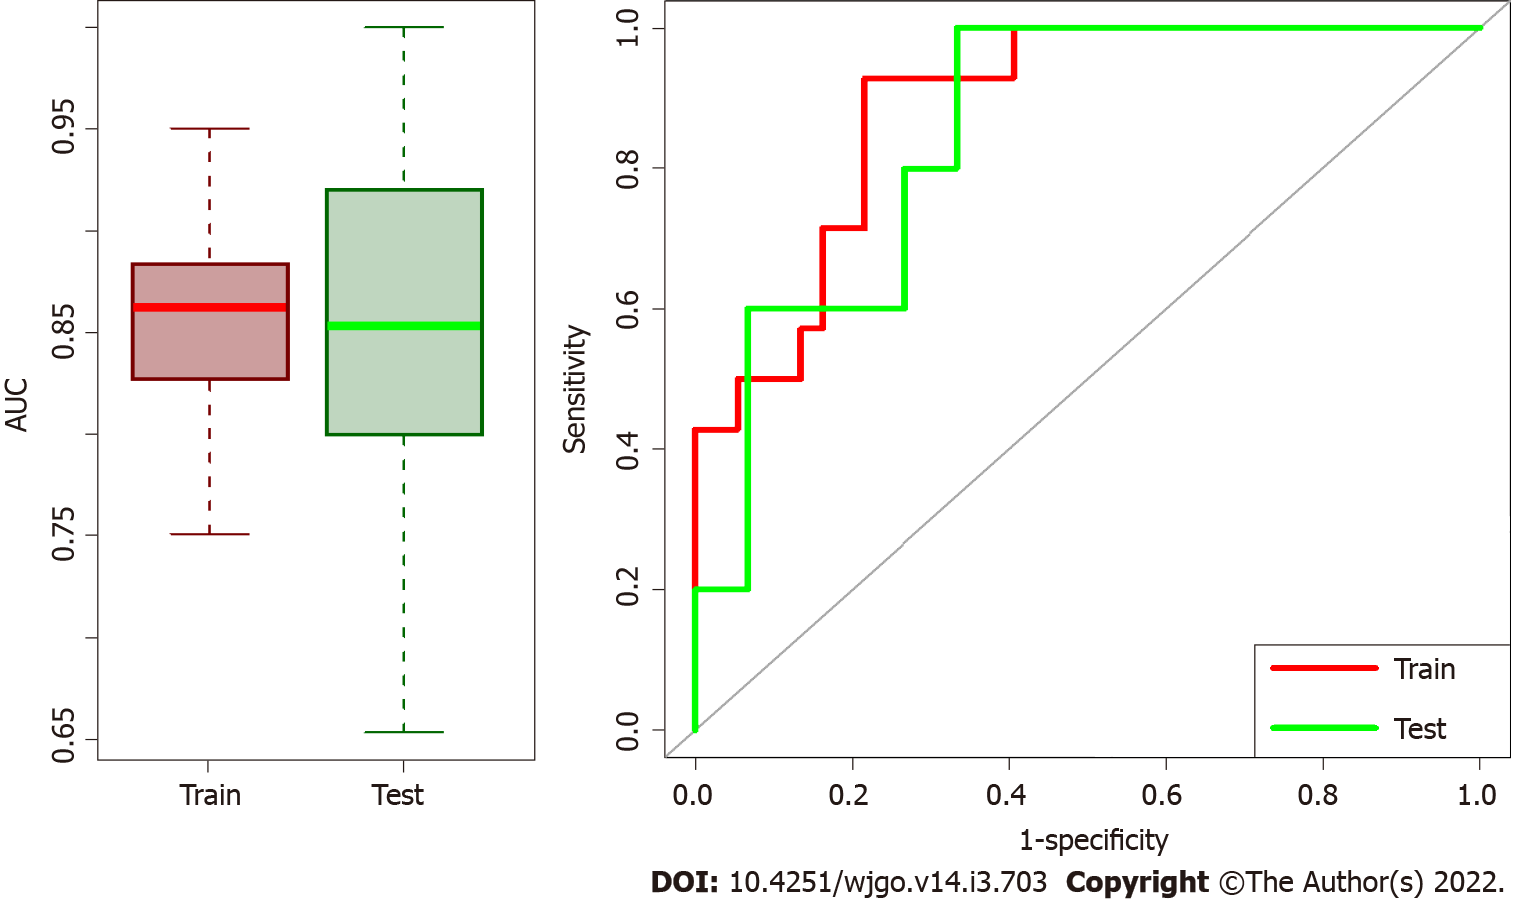
Figure 3 Box plots of area under the receiver operating characteristic curve distributions and receiver operating characteristic curves for test/train datasets.
The first part of training model and validation was repeated 100 times and Box plots of area under the receiver operating characteristic (ROC) curve (AUC) distributions for test/train datasets are represented on the left side. Median AUC both for train and validation sets are higher than 0.85 meaning that the model has high performance in both datasets. On the right the ROC curves of the median solution among the repetitions both for train and validation test are shown.
- Citation: Rossi G, Altabella L, Simoni N, Benetti G, Rossi R, Venezia M, Paiella S, Malleo G, Salvia R, Guariglia S, Bassi C, Cavedon C, Mazzarotto R. Computed tomography-based radiomic to predict resectability in locally advanced pancreatic cancer treated with chemotherapy and radiotherapy. World J Gastrointest Oncol 2022; 14(3): 703-715
- URL: https://www.wjgnet.com/1948-5204/full/v14/i3/703.htm
- DOI: https://dx.doi.org/10.4251/wjgo.v14.i3.703


