Copyright
©The Author(s) 2022.
World J Gastrointest Oncol. Nov 15, 2022; 14(11): 2097-2107
Published online Nov 15, 2022. doi: 10.4251/wjgo.v14.i11.2097
Published online Nov 15, 2022. doi: 10.4251/wjgo.v14.i11.2097
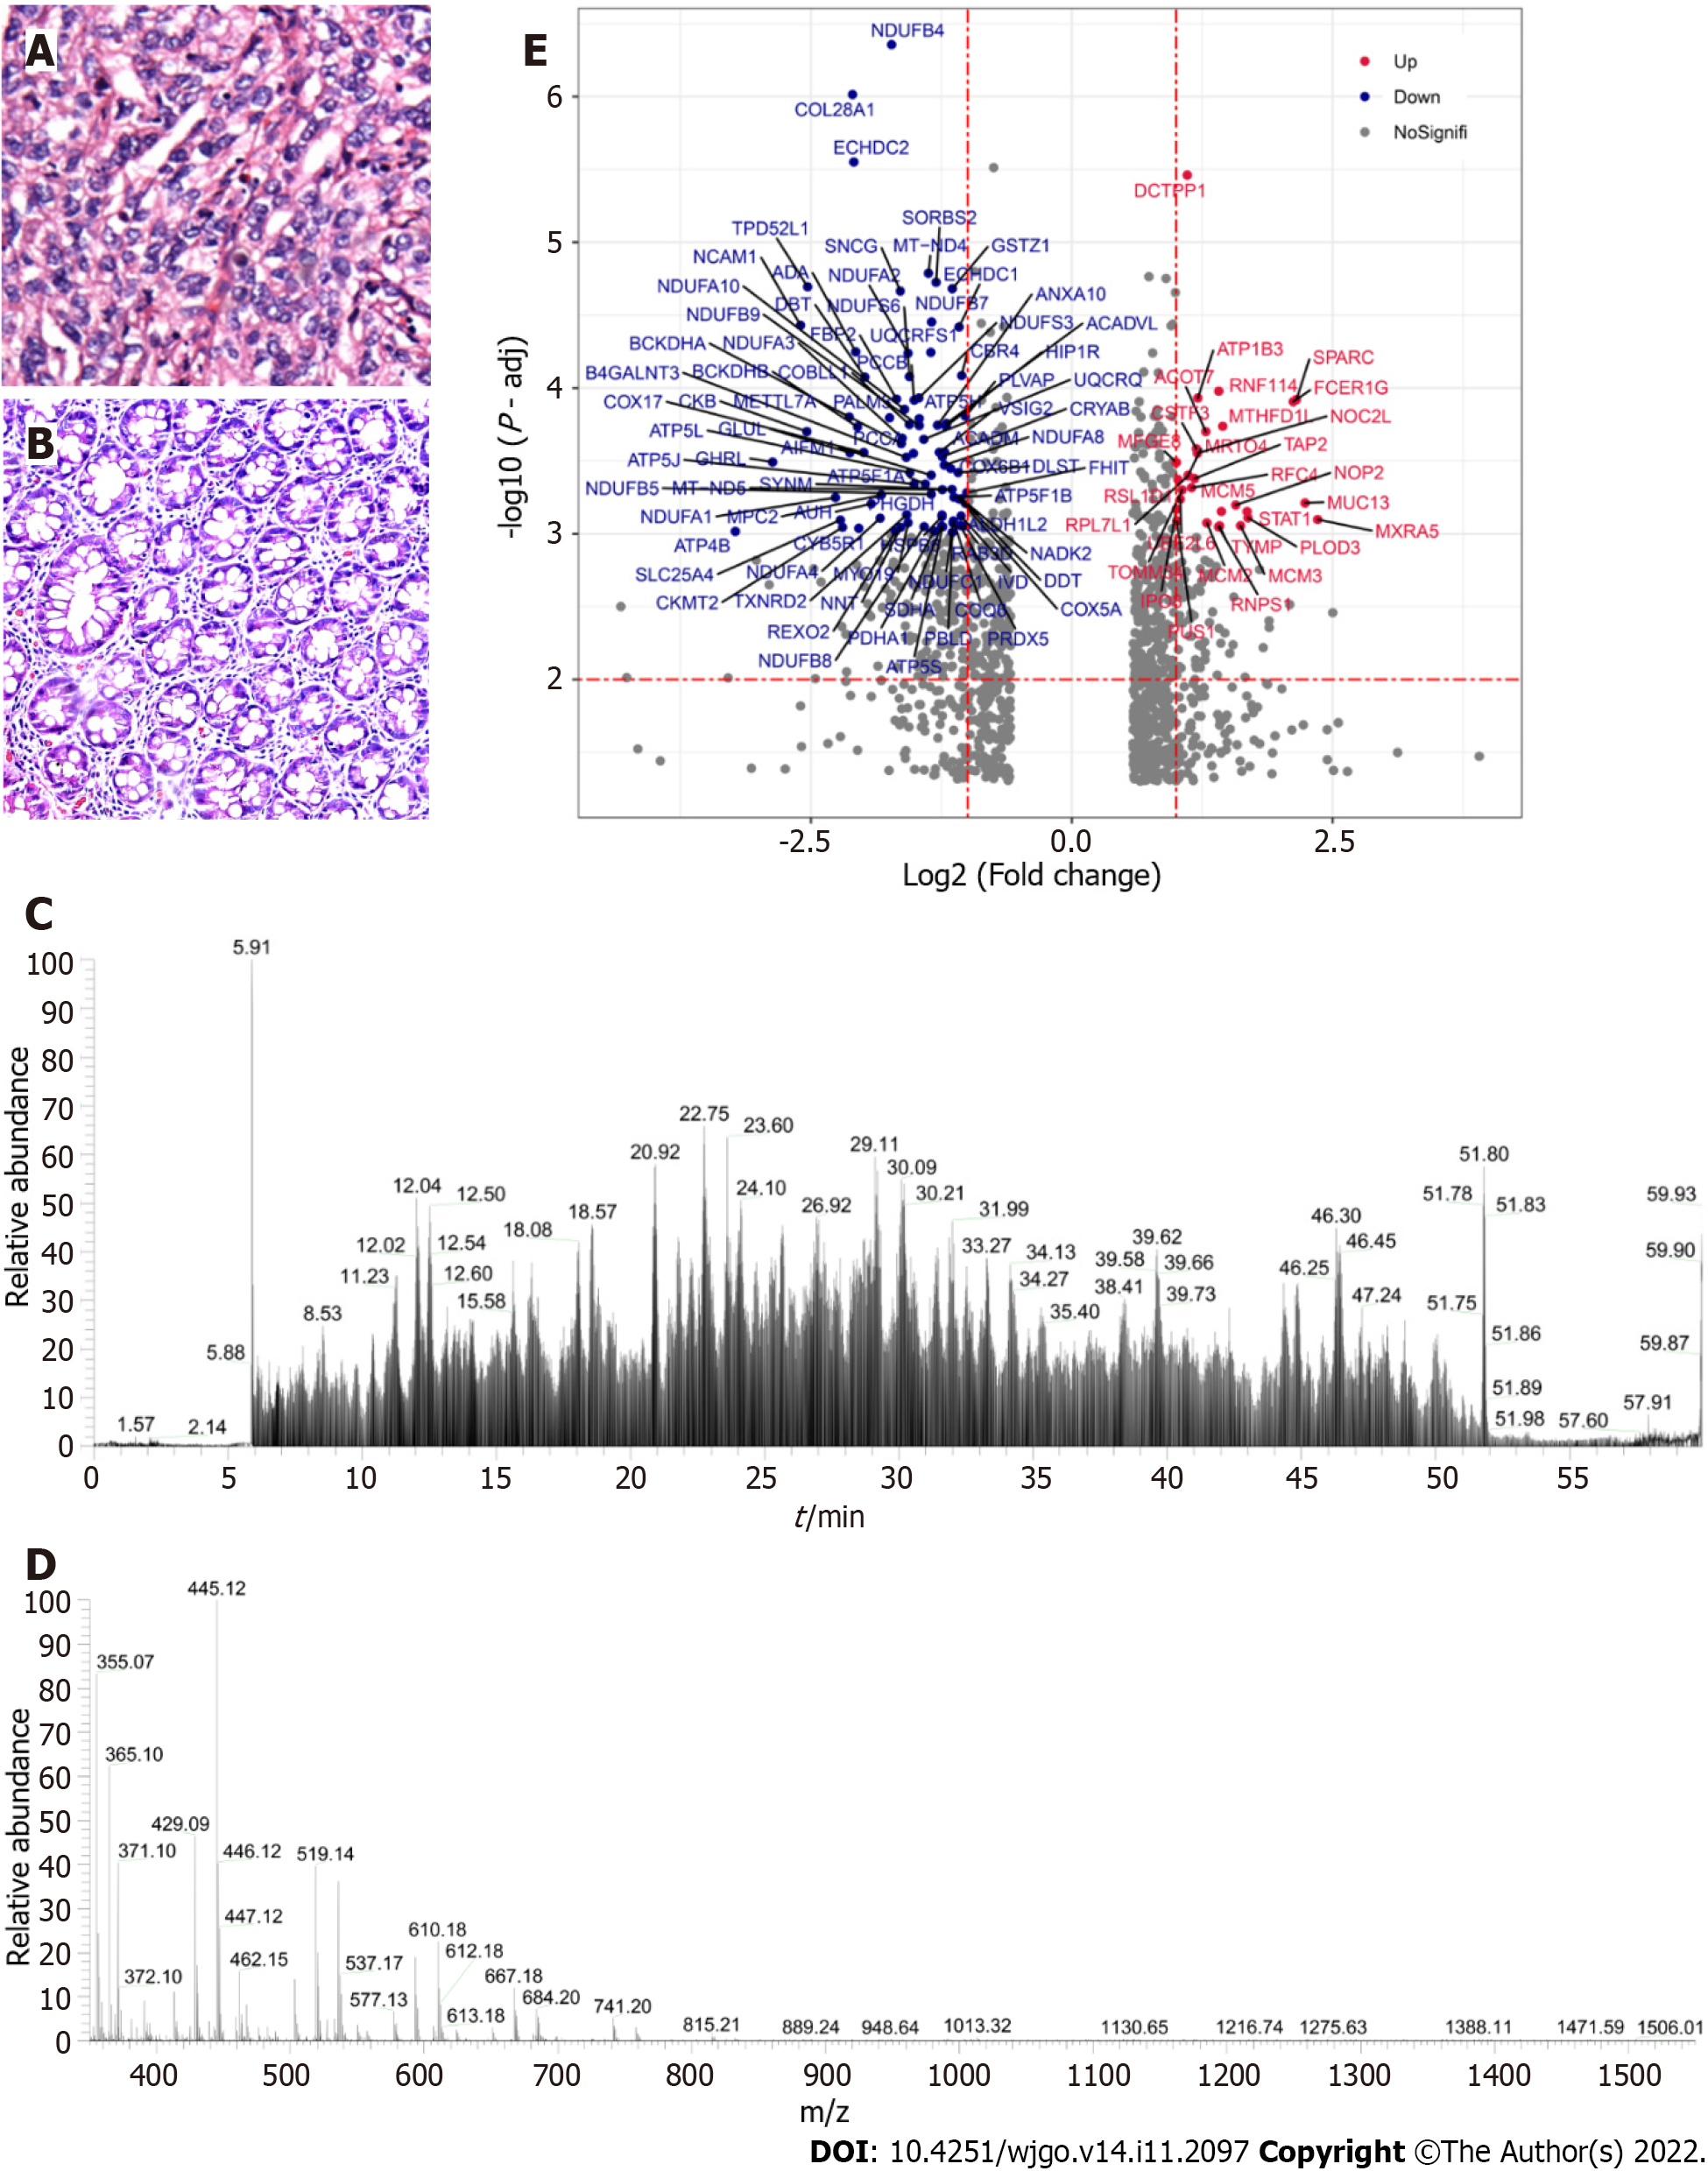
Figure 2 Volcano map of significant differentially expressed proteins.
A and B: Representative images of hematoxylin and eosin stained infiltrative gastric cancer (IGC) (A) and normal gastric tissues (B); C: Base peak chromatogram of tissue sample on Orbitrap LTQ-LC/MS-CID activation; D: Expanded region of a single FTMS full scan with a mass range of m/z 350-1800, and ion peaks with double or higher charge (612.30, Z = 3); E: Volcano map showing differentially expressed proteins between IGC and normal tissues. P-adj: Corrected P value; Fold change: Ratio of expression levels in cancer and adjacent tissues.
- Citation: Zhang LH, Zhuo HQ, Hou JJ, Zhou Y, Cheng J, Cai JC. Proteomic signatures of infiltrative gastric cancer by proteomic and bioinformatic analysis. World J Gastrointest Oncol 2022; 14(11): 2097-2107
- URL: https://www.wjgnet.com/1948-5204/full/v14/i11/2097.htm
- DOI: https://dx.doi.org/10.4251/wjgo.v14.i11.2097


