Copyright
©The Author(s) 2022.
World J Gastrointest Oncol. Oct 15, 2022; 14(10): 1981-2003
Published online Oct 15, 2022. doi: 10.4251/wjgo.v14.i10.1981
Published online Oct 15, 2022. doi: 10.4251/wjgo.v14.i10.1981
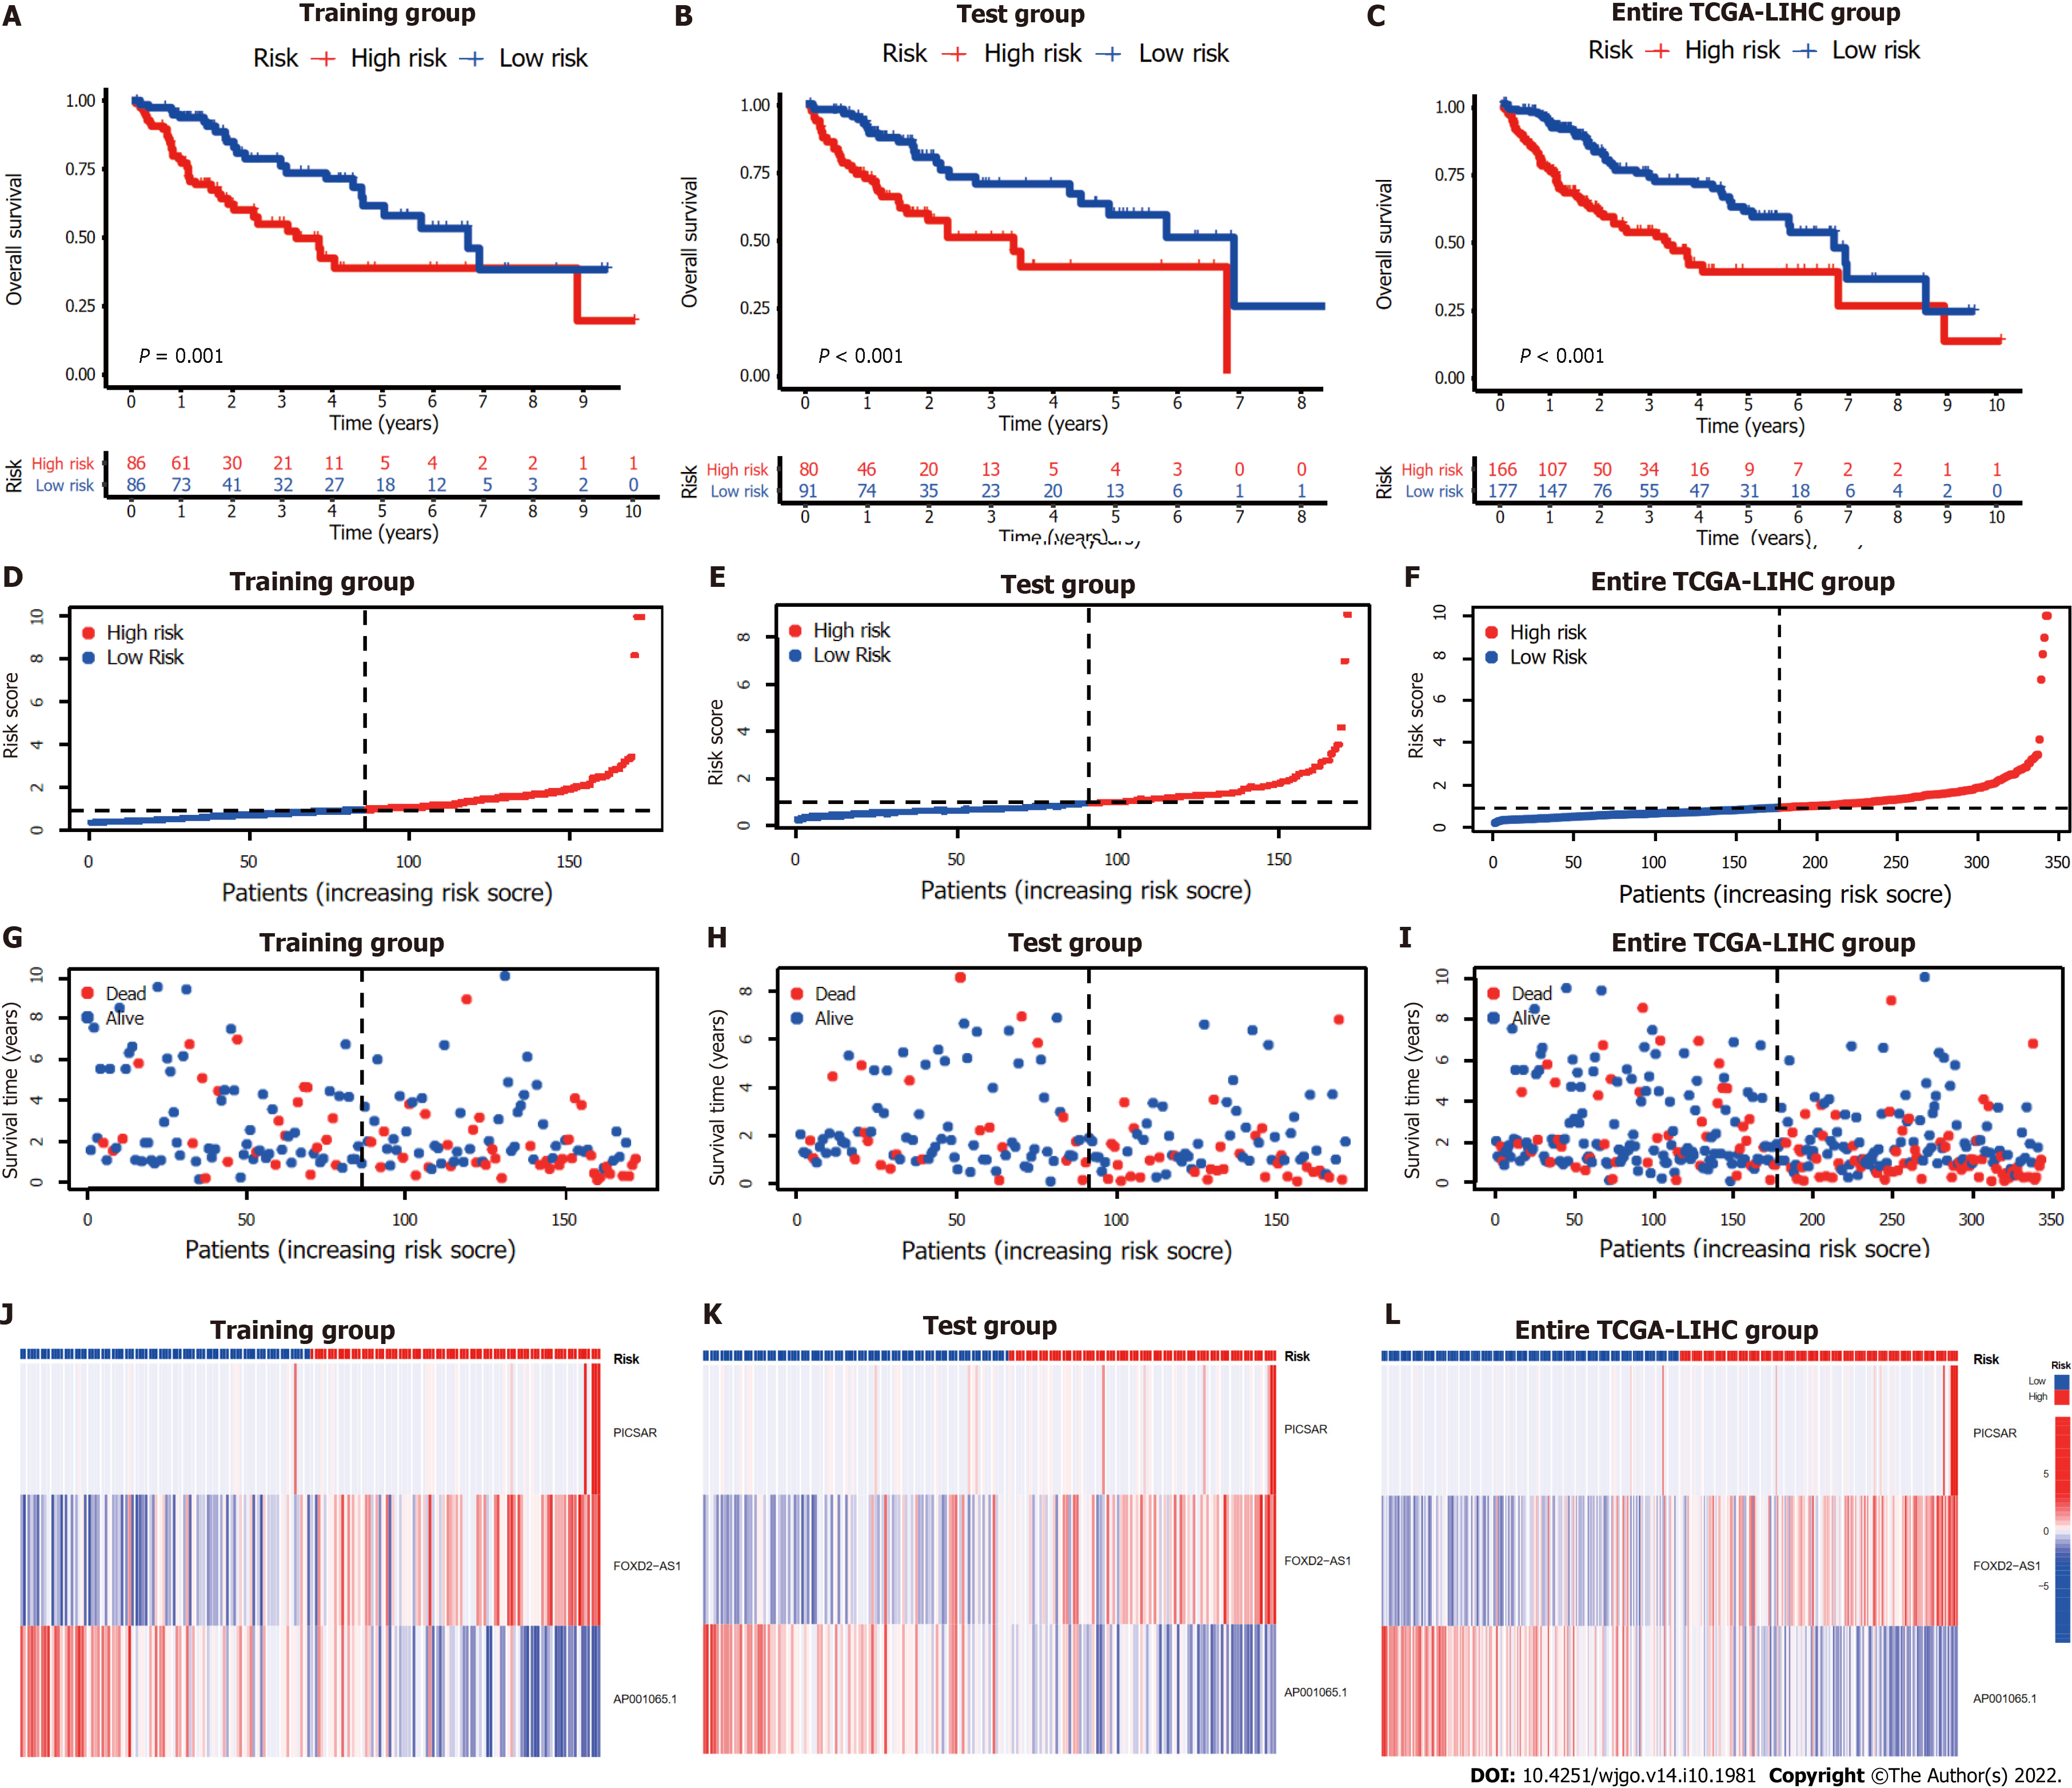
Figure 3 Internal validation of cuproptosis-related long-chain non-coding RNA signature (CupRLSig) model for determination of overall survival in training, test, and entire The Cancer Genome Atlas-Live Hepatocellular Carcinoma groups.
A-C: Kaplan-Meier survival curves in the high- and low-risk groups stratified by median CupRLSig risk scores for overall survival in the training set (A), test set (B), and entire The Cancer Genome Atlas-Live Hepatocellular Carcinoma (TCGA-LIHC) dataset (C); P values were determined using the log-rank test; D-F: Risk curves were based on the risk score for each sample in the training (D), test (E), and entire TCGA-LIHC (F) sets, where red and blue dots indicate high- and low-risk samples, respectively; G-I: The scatter plot was based on the survival status of each sample from the training (G), test (H), and entire TCGA-LIHC (I) sets, where red and blue dots indicate death and survival, respectively; J-L: Heatmaps detailing the expression levels of the three cuproptosis-related long-chain non-coding RNA (lncRNA) signature (CupRLSig) lncRNAs in each group. TCGA-LIHC: The Cancer Genome Atlas-Live Hepatocellular Carcinoma.
- Citation: Huang EM, Ma N, Ma T, Zhou JY, Yang WS, Liu CX, Hou ZH, Chen S, Zong Z, Zeng B, Li YR, Zhou TC. Cuproptosis-related long non-coding RNAs model that effectively predicts prognosis in hepatocellular carcinoma. World J Gastrointest Oncol 2022; 14(10): 1981-2003
- URL: https://www.wjgnet.com/1948-5204/full/v14/i10/1981.htm
- DOI: https://dx.doi.org/10.4251/wjgo.v14.i10.1981


