
















©The Author(s) 2021.
World J Gastrointest Oncol. Feb 15, 2021; 13(2): 109-118
Published online Feb 15, 2021. doi: 10.4251/wjgo.v13.i2.109
Published online Feb 15, 2021. doi: 10.4251/wjgo.v13.i2.109
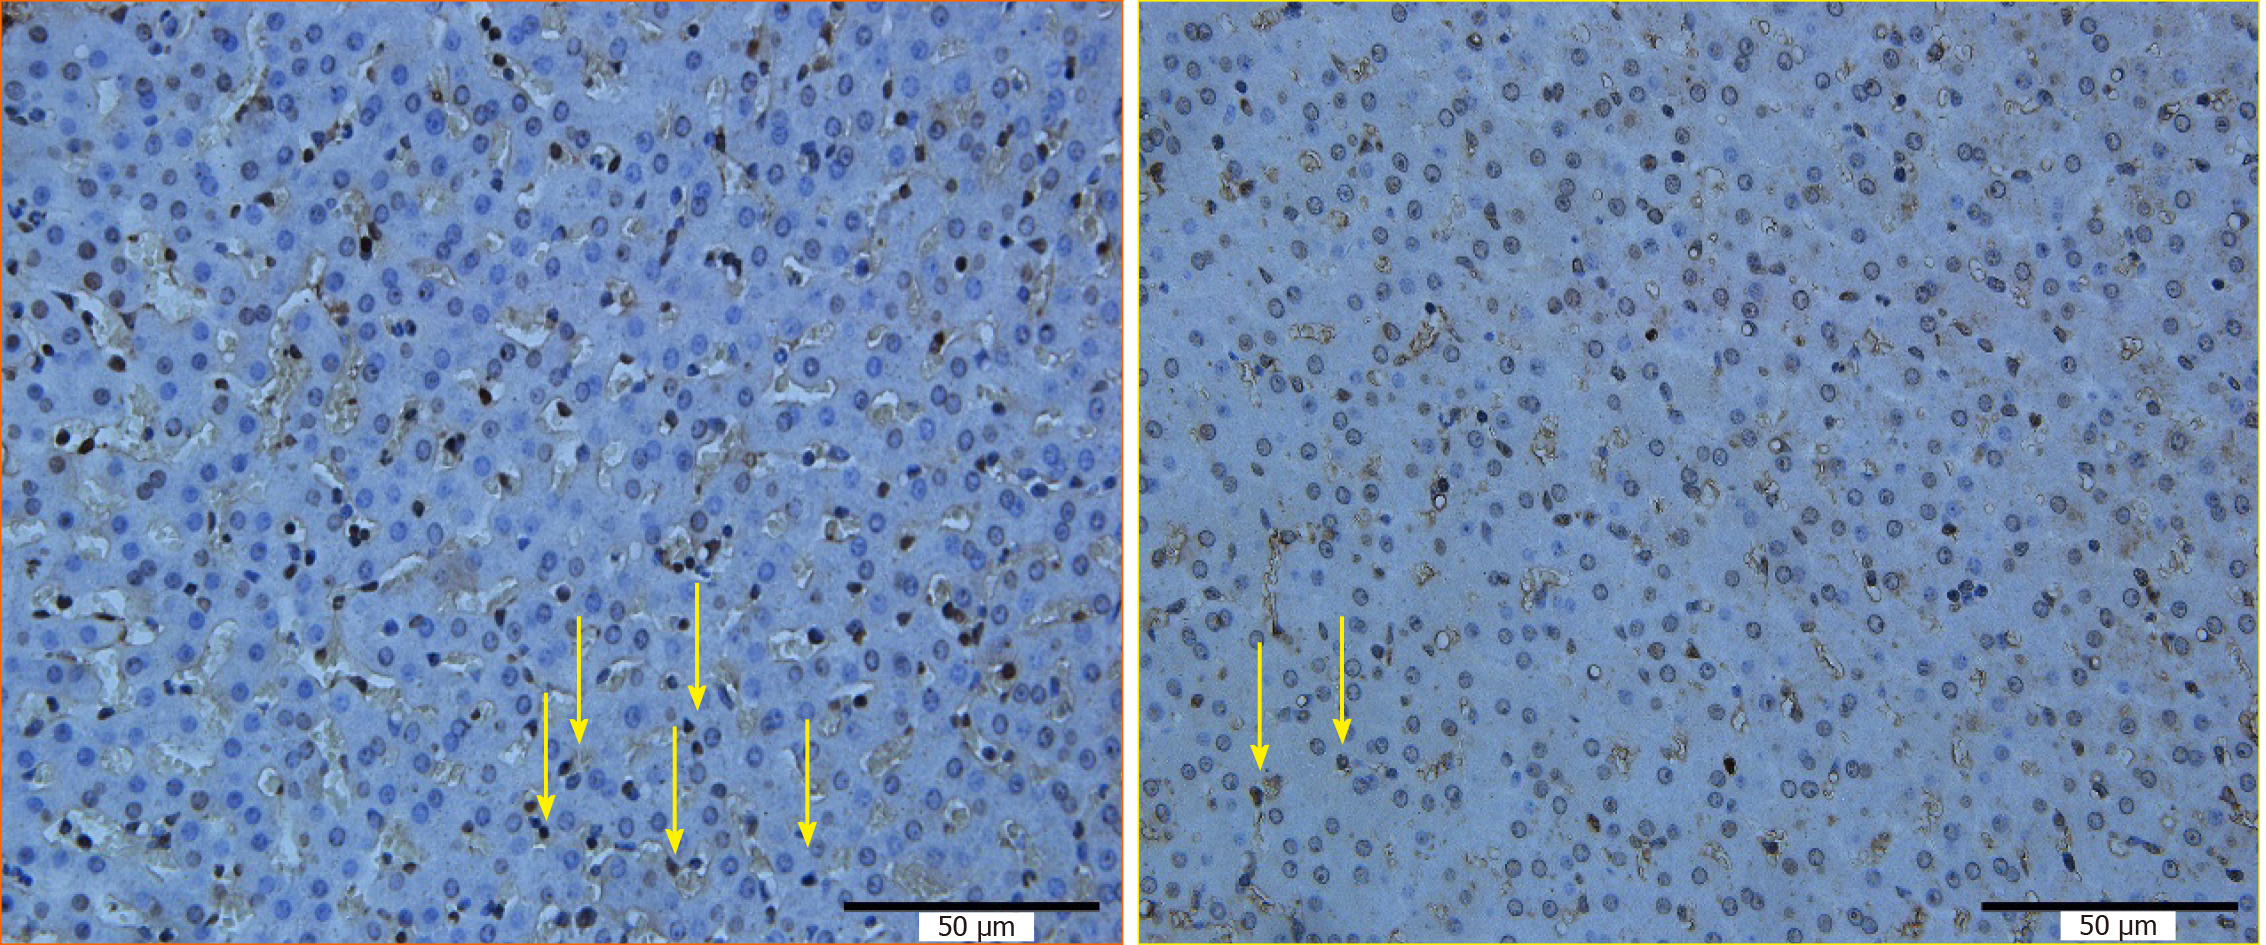
Figure 5 Diagram of TUNEL detection results (400 ×).
The left figure shows the liver tissue around the radiofrequency ablation site and the distal portal vein in group A where there was more liver cell apoptosis. The right figure shows the liver tissue around the radiofrequency ablation site and the distal portal vein in group B where there were less liver cell apoptosis.
- Citation: Feng J, Wang S, Jiang K. Influence of the heat irrigating effect of radiofrequency ablation on regional liver tissue in Bama miniature pigs. World J Gastrointest Oncol 2021; 13(2): 109-118
- URL: https://www.wjgnet.com/1948-5204/full/v13/i2/109.htm
- DOI: https://dx.doi.org/10.4251/wjgo.v13.i2.109