Copyright
©The Author(s) 2021.
World J Gastrointest Oncol. Feb 15, 2021; 13(2): 109-118
Published online Feb 15, 2021. doi: 10.4251/wjgo.v13.i2.109
Published online Feb 15, 2021. doi: 10.4251/wjgo.v13.i2.109
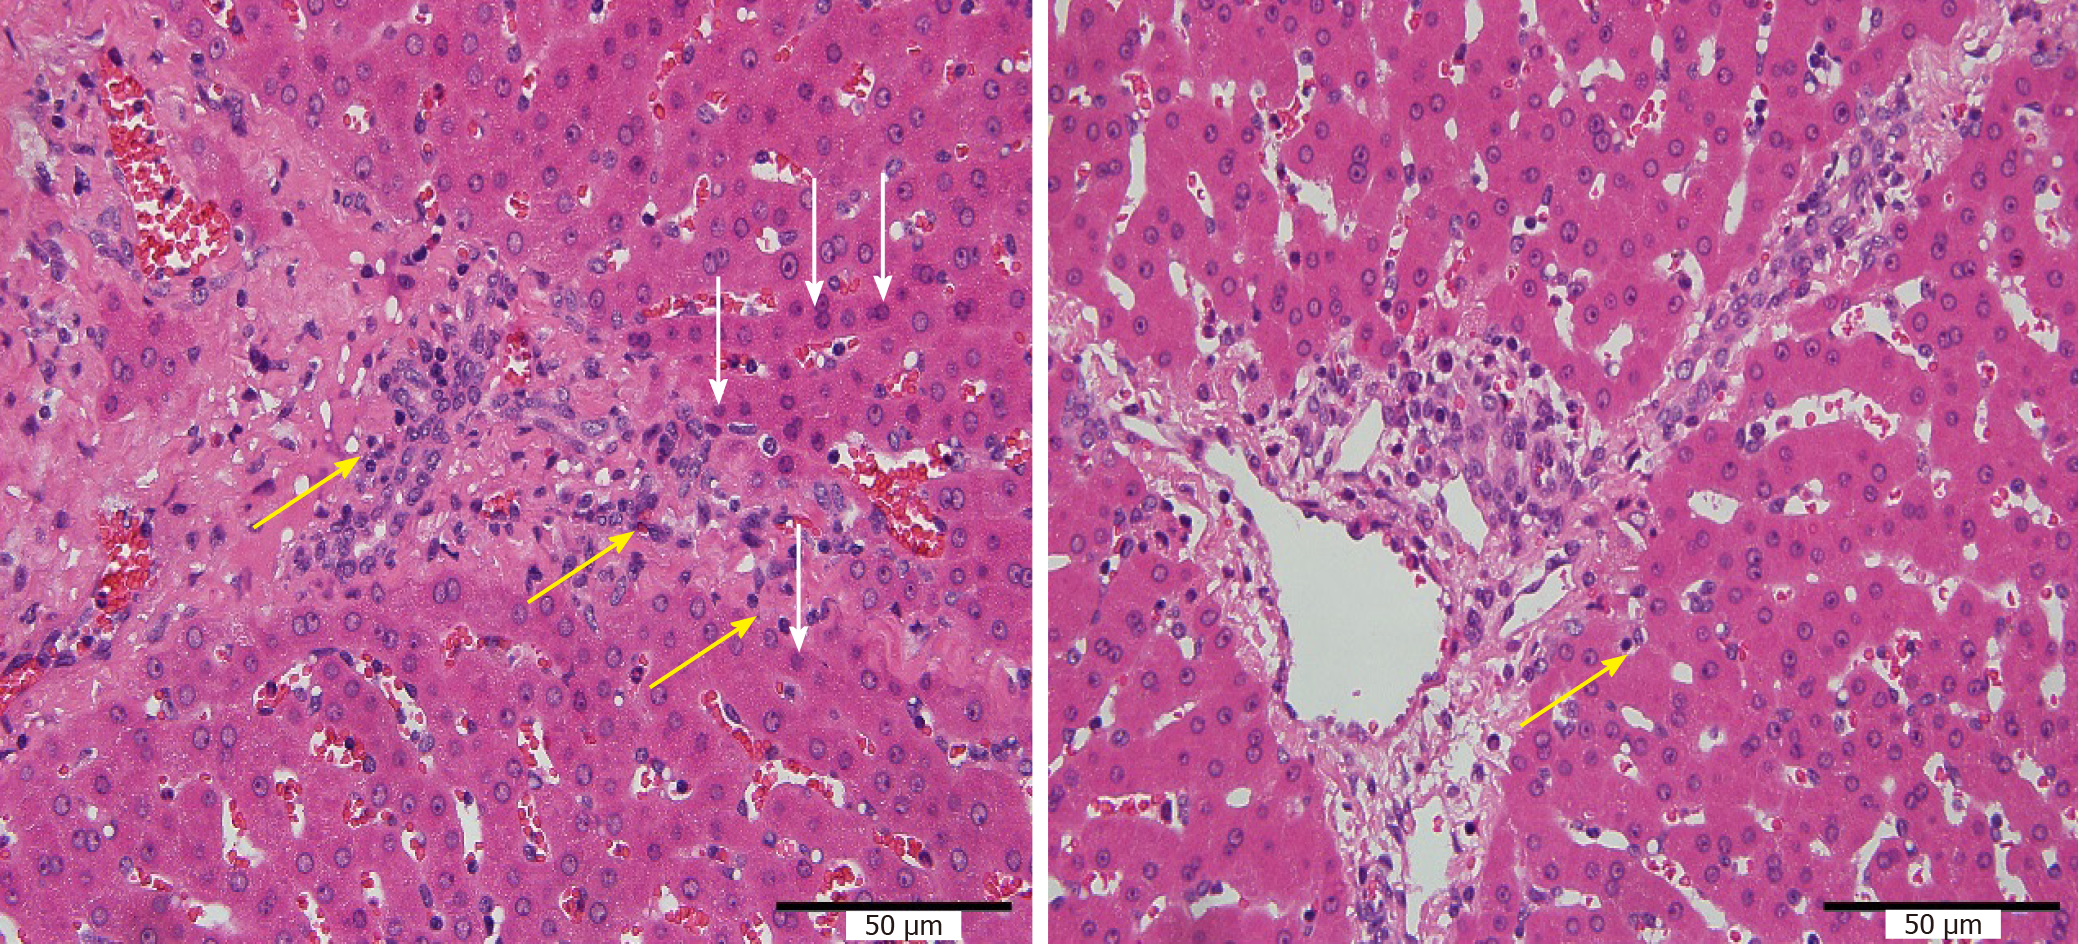
Figure 4 Diagram of hematoxylin-eosin staining results (400 ×).
The left figure shows that in the liver tissue around the distal portal vein beyond the radiofrequency ablation site in group A, there were more necrotic cells and slightly serious cell vacuolization, and more inflammatory cell infiltration. The right figure shows that in the liver tissue around the distal portal vein beyond the radiofrequency ablation site in group B, there were fewer necrotic cells, less serious cell vacuolization, and less inflammatory cell infiltration.
- Citation: Feng J, Wang S, Jiang K. Influence of the heat irrigating effect of radiofrequency ablation on regional liver tissue in Bama miniature pigs. World J Gastrointest Oncol 2021; 13(2): 109-118
- URL: https://www.wjgnet.com/1948-5204/full/v13/i2/109.htm
- DOI: https://dx.doi.org/10.4251/wjgo.v13.i2.109


