Copyright
©The Author(s) 2020.
World J Gastrointest Oncol. Apr 15, 2020; 12(4): 503-513
Published online Apr 15, 2020. doi: 10.4251/wjgo.v12.i4.503
Published online Apr 15, 2020. doi: 10.4251/wjgo.v12.i4.503
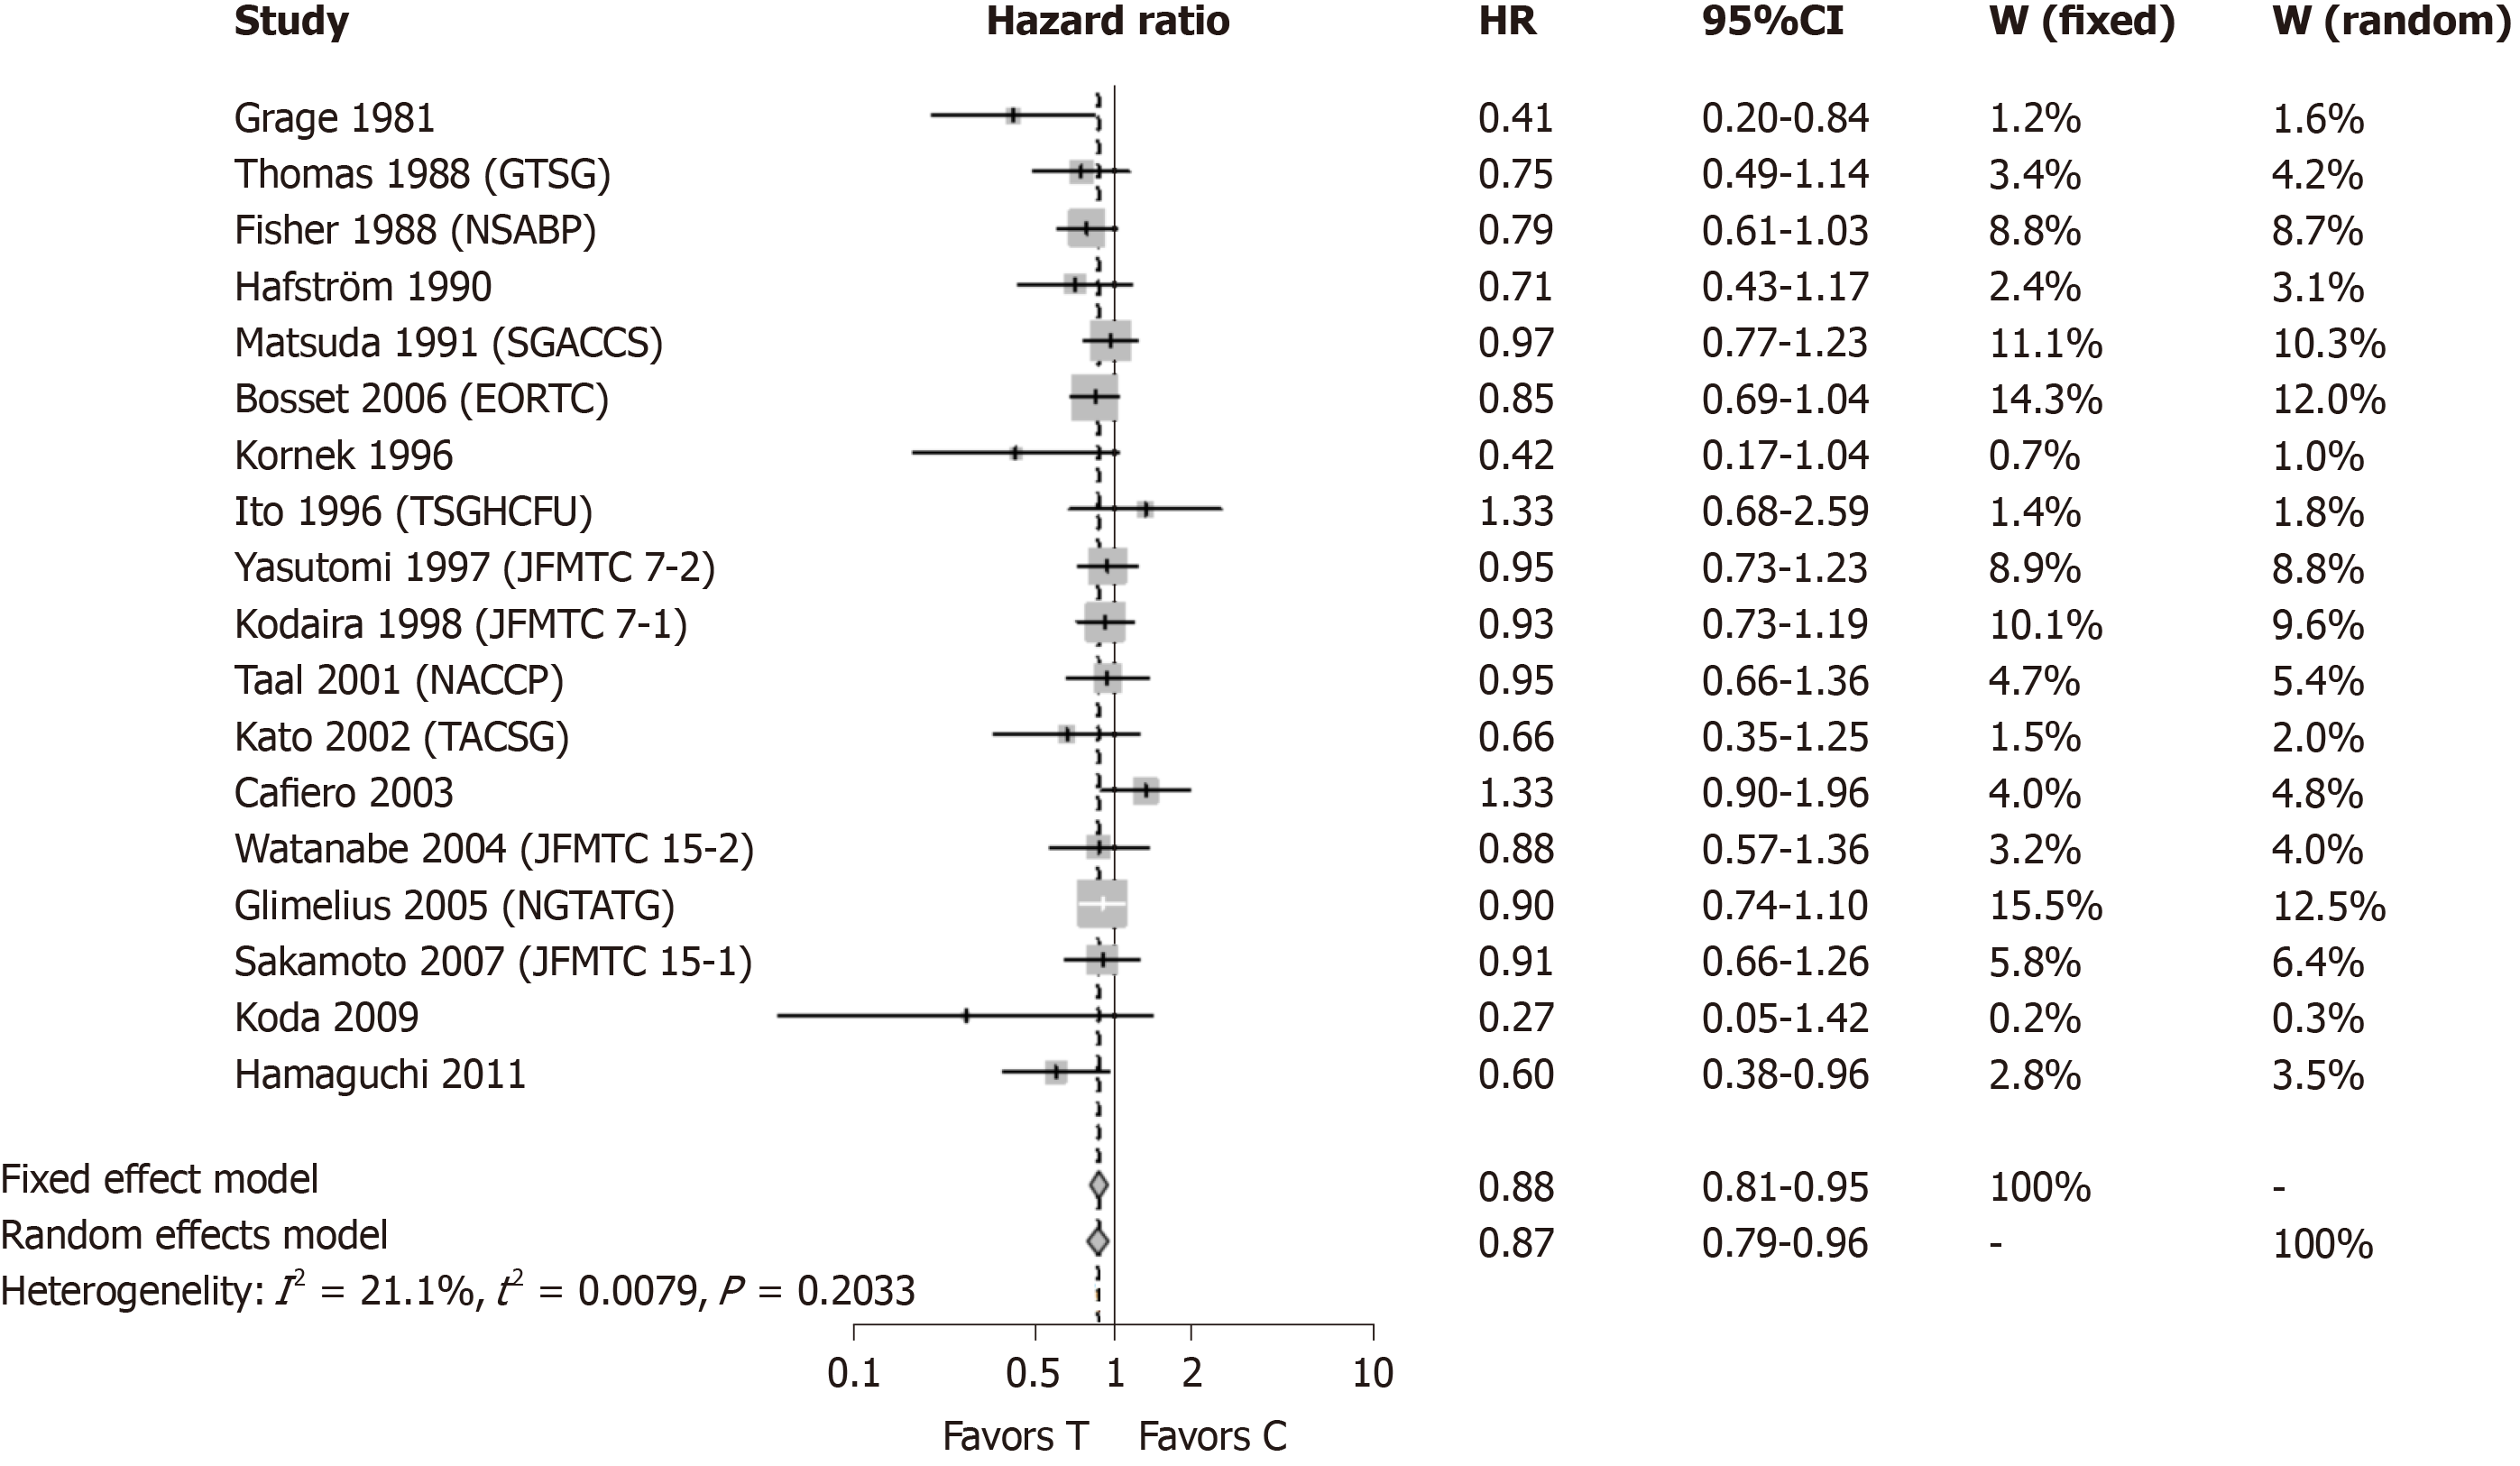
Figure 2 Meta-analysis of n = 18 studies after the exclusion of the three analyzed studies.
Each study included in the meta-analysis is represented on the forest plot by a box [put either in the region of favors (T) or favors (C) of the graphic according to the hazard ratio] and a line which indicates the 95% confidence interval. The pooled hazard ratio of the meta-analysis is represented by a diamond. In this case the estimate of overall effect is in the region which favors the treatment [favors (T)]. HR: Hazard ratio; CI: Confidence interval; W(fixed): Weight assigned to the study by using a fixed effect model; W(random): Weight assigned to the study by using a random effect model; Favors (T): Result in favor of the treatment (intervention) group (i.e., adjuvant chemotherapy after curative surgery); Favors(C): Result in favor of the control group (no adjuvant chemotherapy after surgery).
- Citation: Manzini G, Hapke F, Hines IN, Henne-Bruns D, Kremer M. Adjuvant chemotherapy in curatively resected rectal cancer: How valid are the data? World J Gastrointest Oncol 2020; 12(4): 503-513
- URL: https://www.wjgnet.com/1948-5204/full/v12/i4/503.htm
- DOI: https://dx.doi.org/10.4251/wjgo.v12.i4.503


