Copyright
©The Author(s) 2019.
World J Gastrointest Oncol. Aug 15, 2019; 11(8): 599-621
Published online Aug 15, 2019. doi: 10.4251/wjgo.v11.i8.599
Published online Aug 15, 2019. doi: 10.4251/wjgo.v11.i8.599
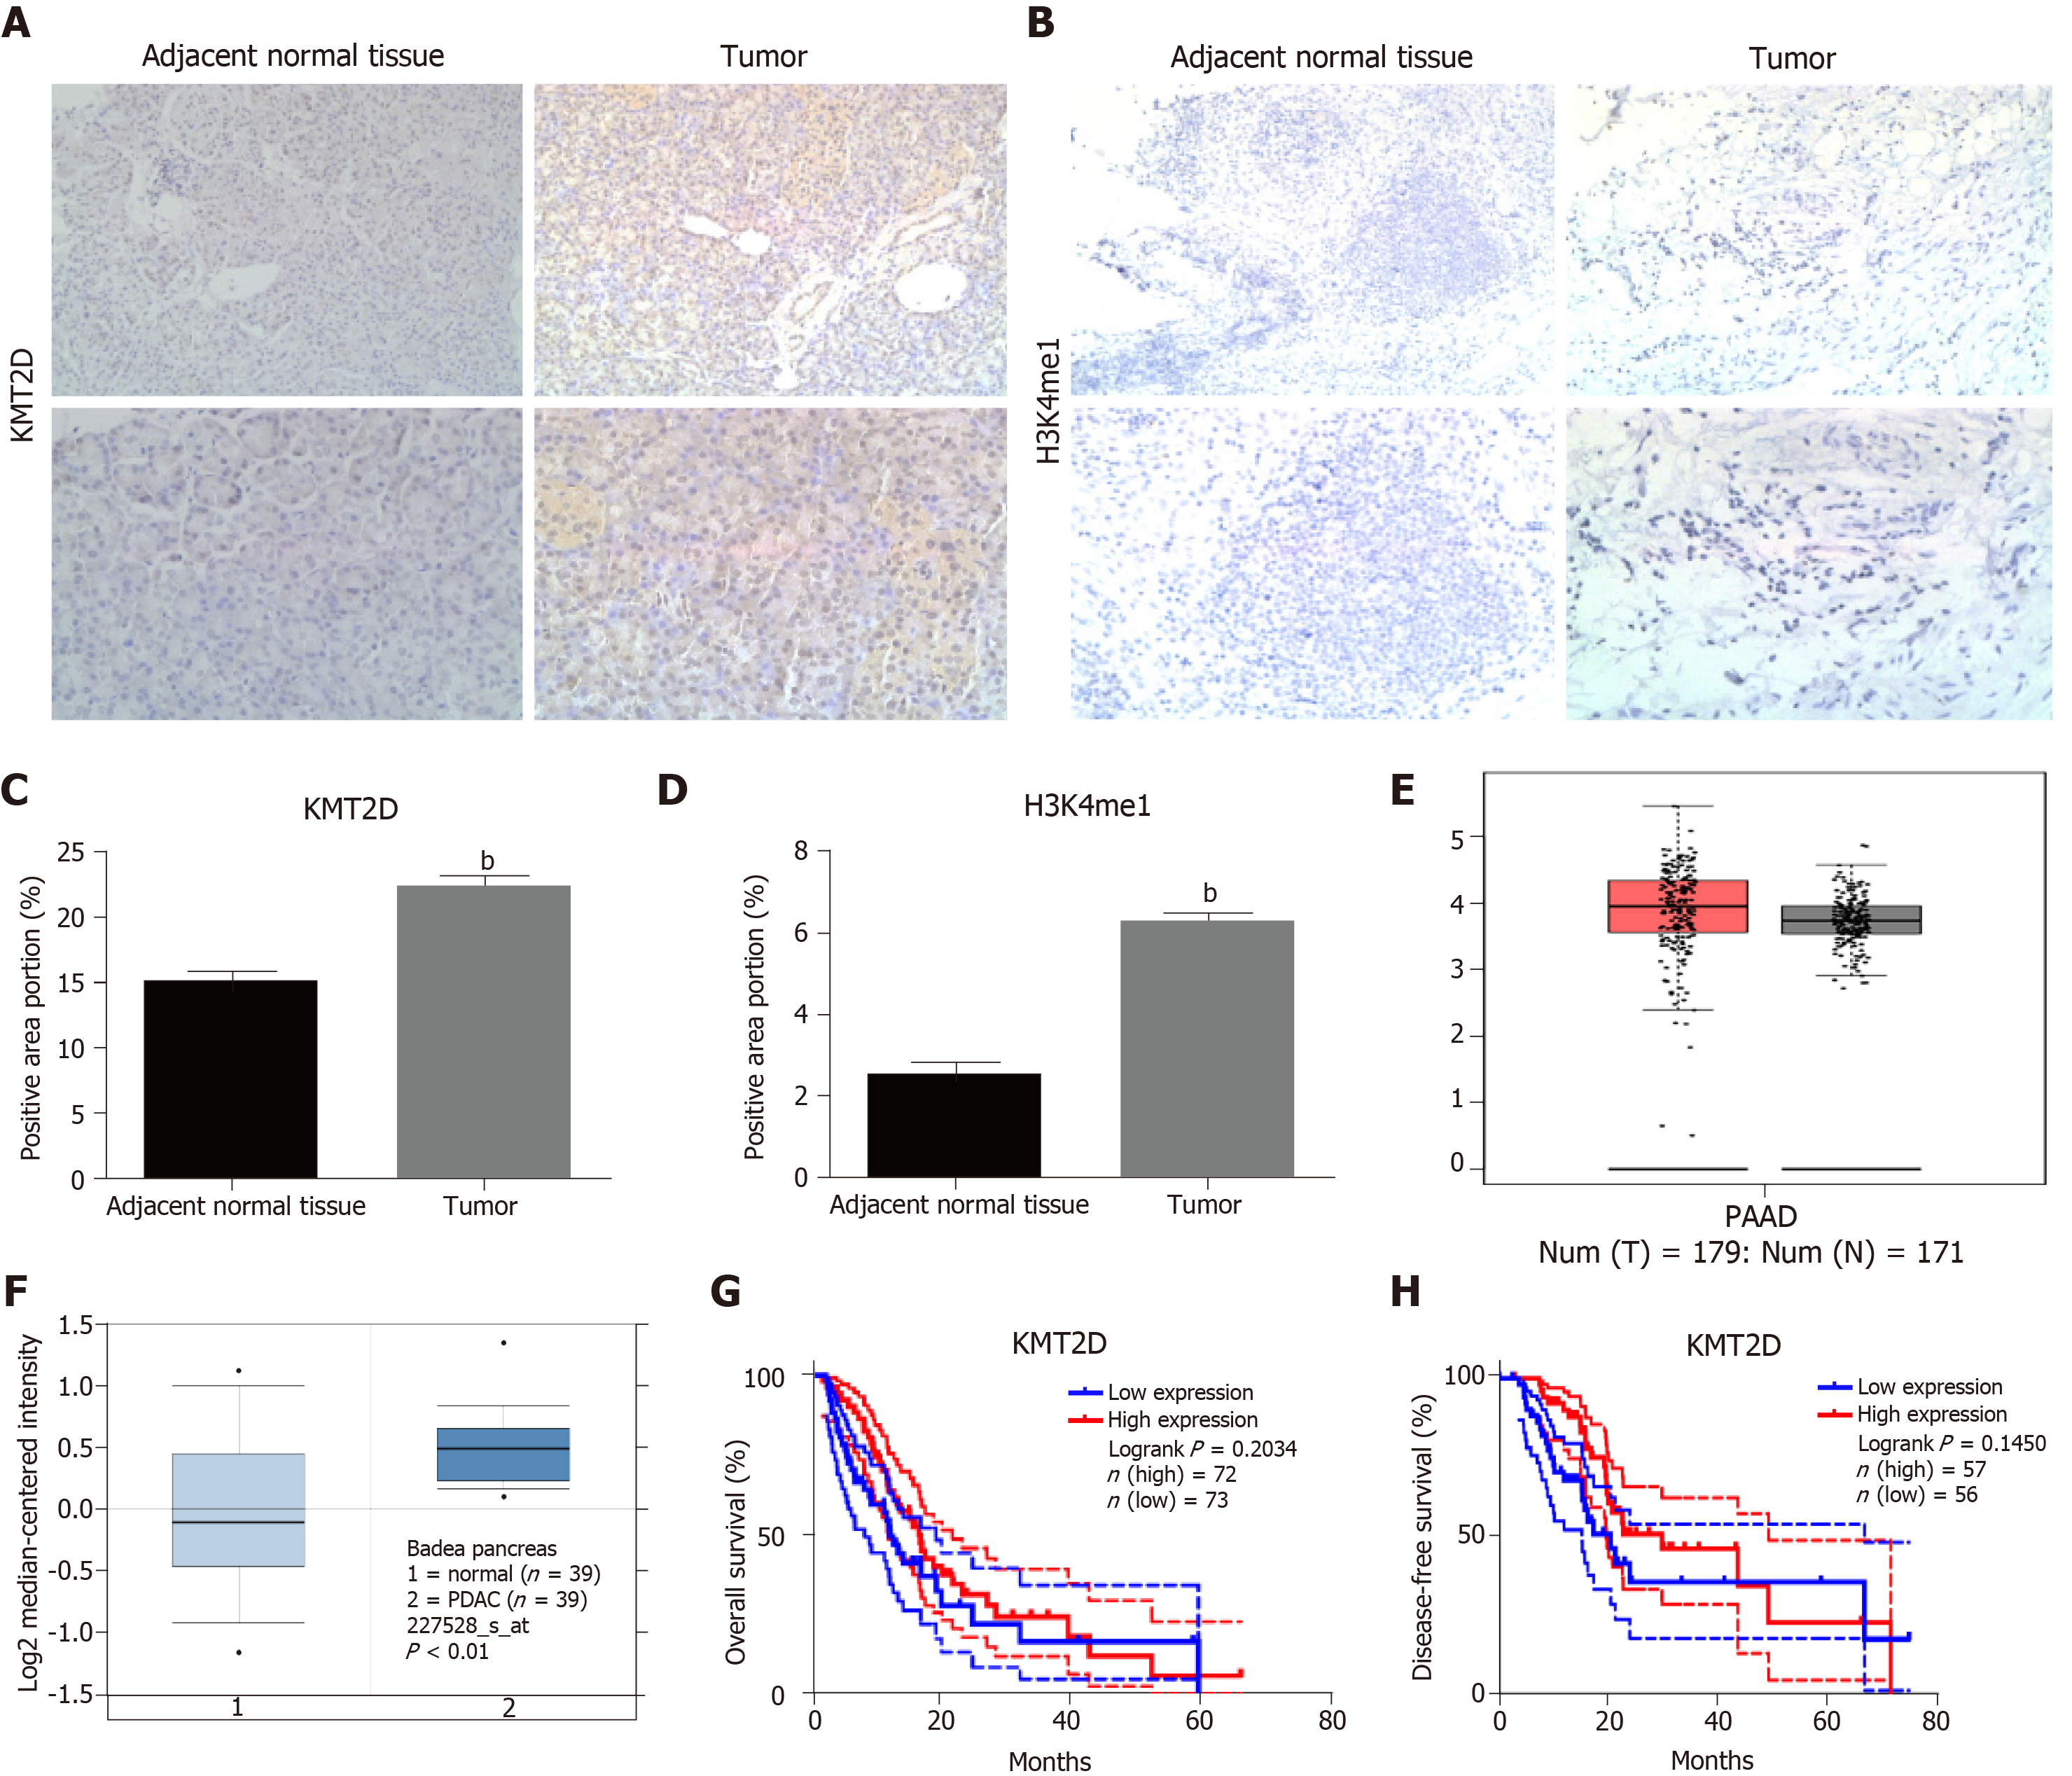
Figure 7 The prognostic value of the KMT2D in pancreatic ductal adenocarcinoma.
A-D: Representative immunohistochemistry images showing KMT2D or H3K4me1 expression in PDAC tissues and paired normal tissues (200× and 400× magnification). The histogram shows the percentage of positively-stained area as calculated by Fiji. Data were expressed as mean ± SEM. bP < 0.01 vs shCTRL group; E, F: Box-plot graph showing KMT2D expression in tumor and normal tissues from GEPIA and Oncomine databases; G, H: Kaplan-Meier curves showing overall survival and disease-free survival of TCGA database patients based on KMT2D expression.
- Citation: Li SS, Jiang WL, Xiao WQ, Li K, Zhang YF, Guo XY, Dai YQ, Zhao QY, Jiang MJ, Lu ZJ, Wan R. KMT2D deficiency enhances the anti-cancer activity of L48H37 in pancreatic ductal adenocarcinoma. World J Gastrointest Oncol 2019; 11(8): 599-621
- URL: https://www.wjgnet.com/1948-5204/full/v11/i8/599.htm
- DOI: https://dx.doi.org/10.4251/wjgo.v11.i8.599


