Copyright
©The Author(s) 2019.
World J Gastrointest Oncol. Apr 15, 2019; 11(4): 281-294
Published online Apr 15, 2019. doi: 10.4251/wjgo.v11.i4.281
Published online Apr 15, 2019. doi: 10.4251/wjgo.v11.i4.281
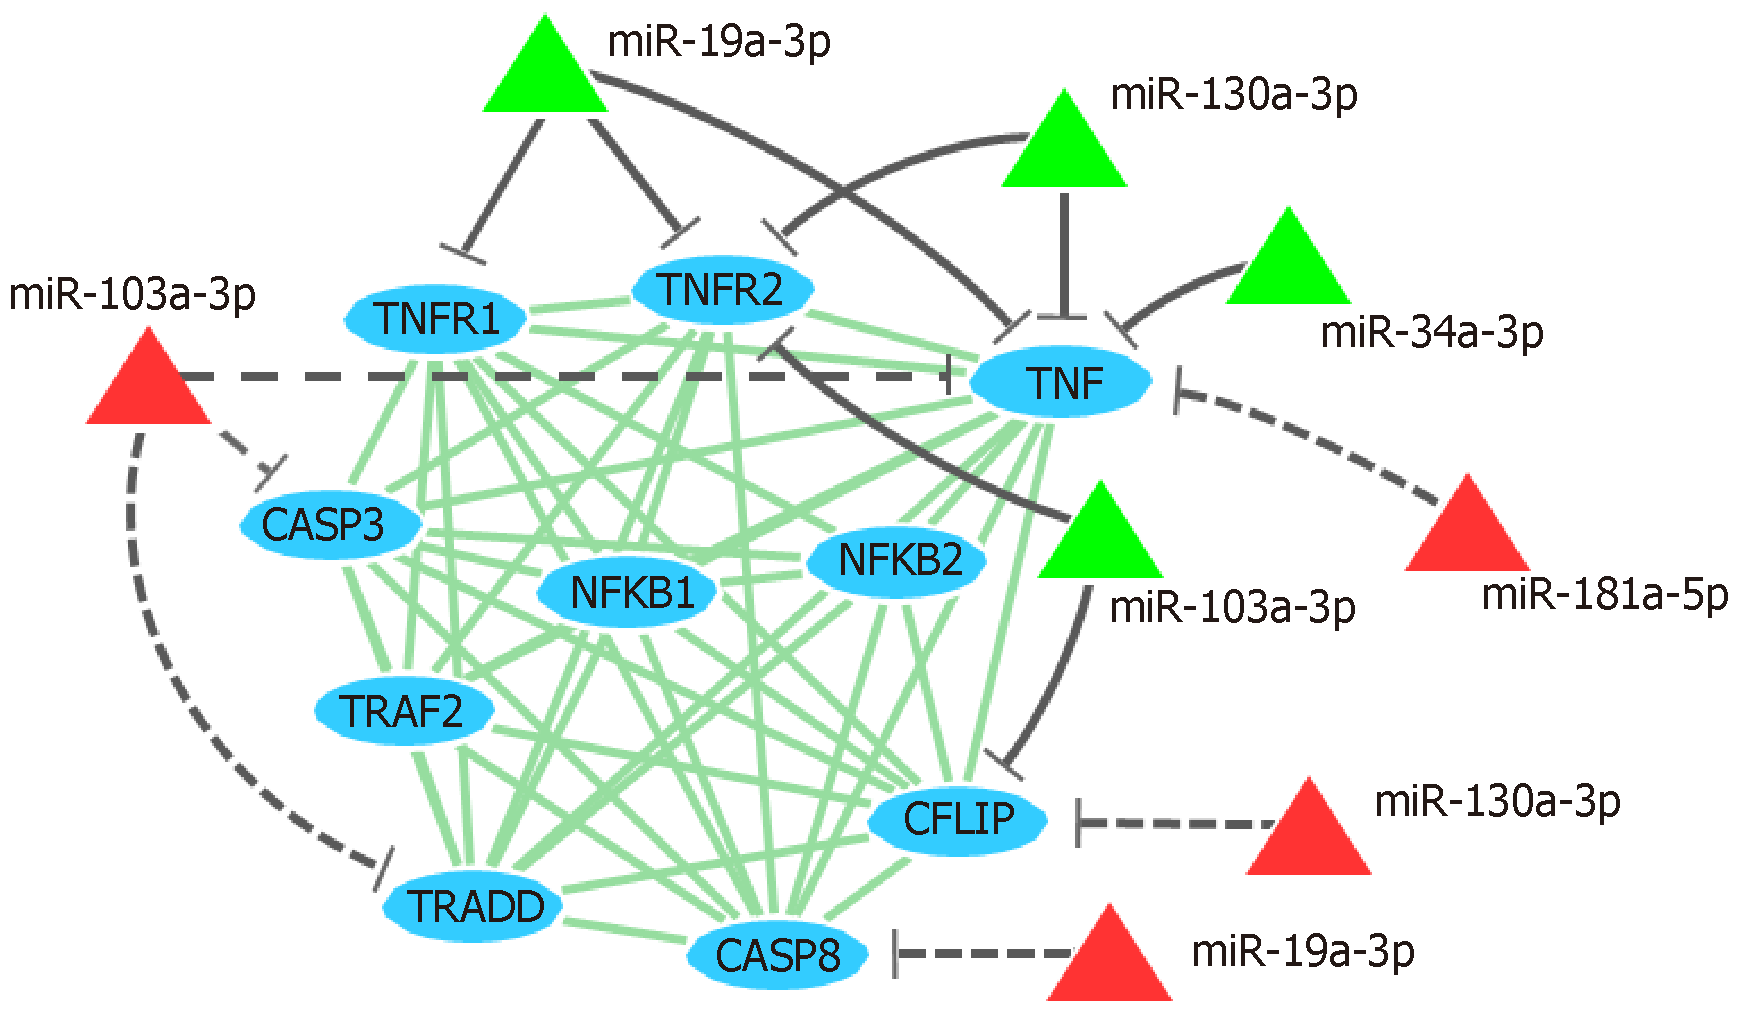
Figure 4 Interaction network showing miRNAs and their predicted and validated targets.
The protein interaction network (light gray lines) shows the interaction between proteins (ellipses) encoded by tumor necrosis factor- pathway genes. Green triangles and solid gray lines represent miRNAs and validated target genes, respectively; red triangles and dotted gray lines represent predicted relationship between miRNA and target genes, respectively. TNF: Tumor necrosis factor.
- Citation: Rossi AFT, Contiero JC, Manoel-Caetano FDS, Severino FE, Silva AE. Up-regulation of tumor necrosis factor-α pathway survival genes and of the receptor TNFR2 in gastric cancer. World J Gastrointest Oncol 2019; 11(4): 281-294
- URL: https://www.wjgnet.com/1948-5204/full/v11/i4/281.htm
- DOI: https://dx.doi.org/10.4251/wjgo.v11.i4.281


