Copyright
©The Author(s) 2019.
World J Gastrointest Oncol. Mar 15, 2019; 11(3): 181-194
Published online Mar 15, 2019. doi: 10.4251/wjgo.v11.i3.181
Published online Mar 15, 2019. doi: 10.4251/wjgo.v11.i3.181
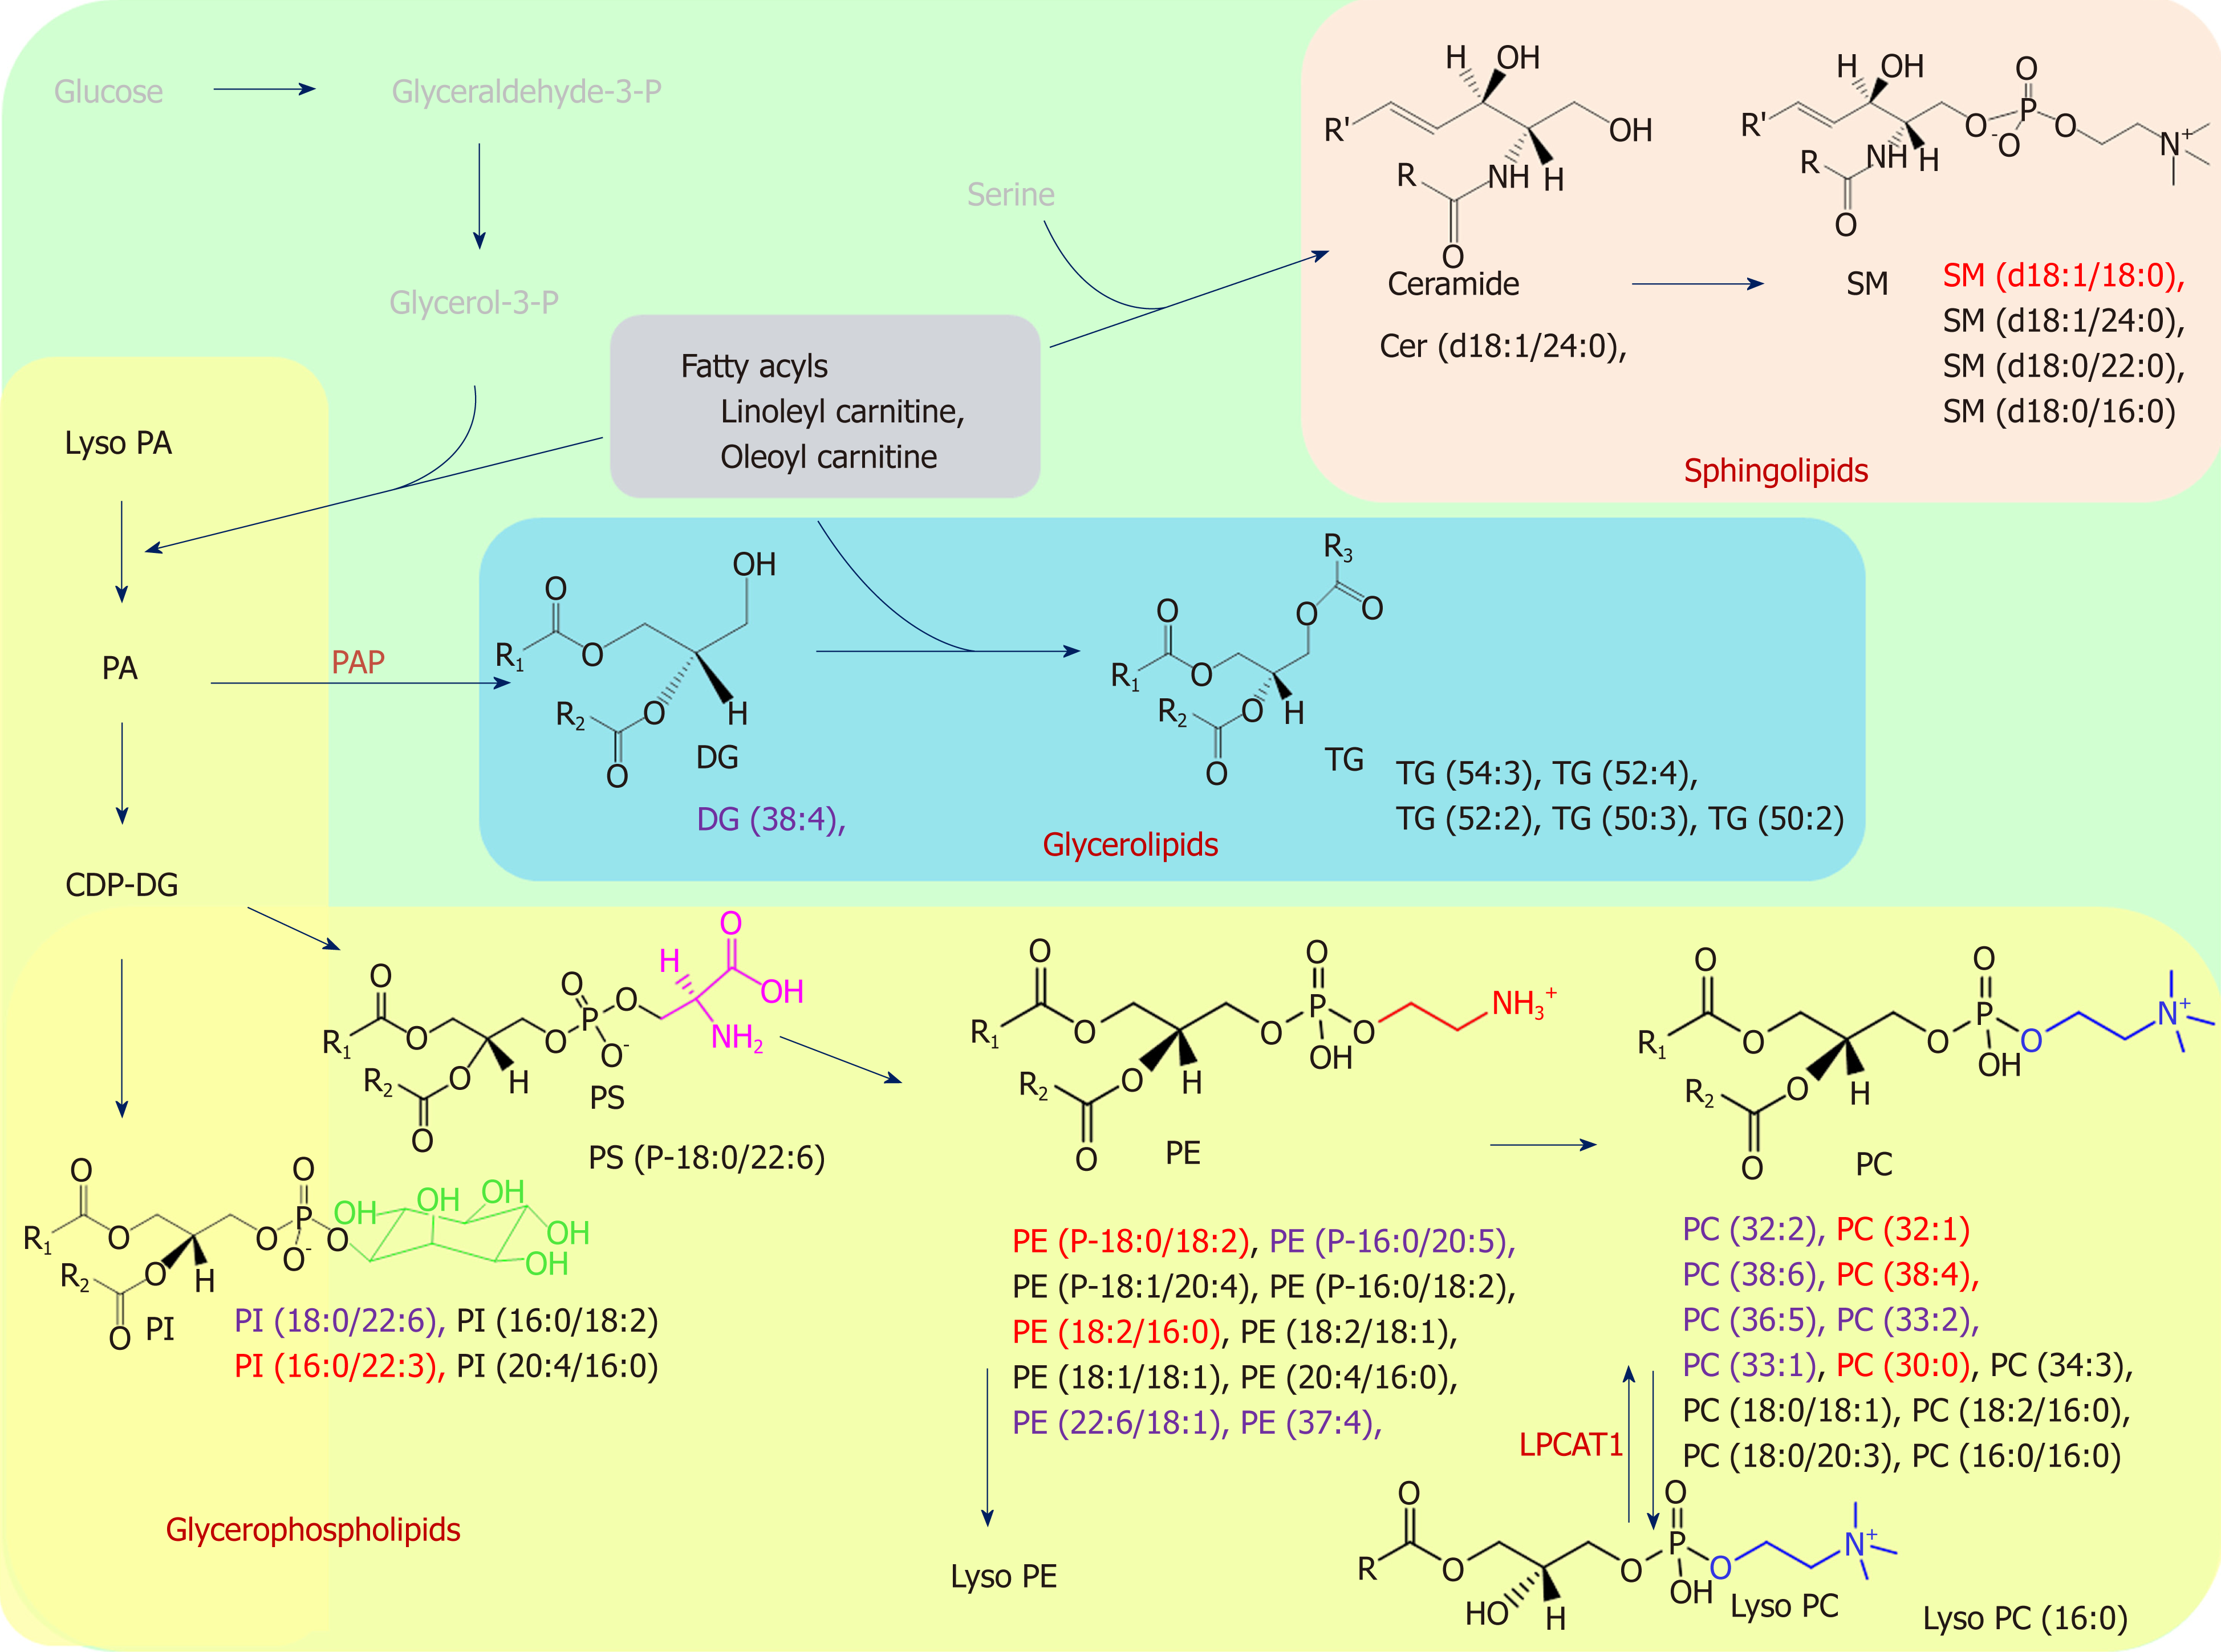
Figure 4 Schematic overview of the lipid biosynthesis pathways in this study was summarized.
Black: Changes according to gastric cancer status; Purple: Only represent in chromosomal instability (CIN) analysis; Red: Both CIN and non-CIN status. We showed the lipid categories which involved in the significant changes of metabolites in this study. R is a carbon chain. PAP: phosphatidic acid phosphatase; LPCAT1: lysophosphatidylcholine acyltransferase 1.
- Citation: Hung CY, Yeh TS, Tsai CK, Wu RC, Lai YC, Chiang MH, Lu KY, Lin CN, Cheng ML, Lin G. Glycerophospholipids pathways and chromosomal instability in gastric cancer: Global lipidomics analysis. World J Gastrointest Oncol 2019; 11(3): 181-194
- URL: https://www.wjgnet.com/1948-5204/full/v11/i3/181.htm
- DOI: https://dx.doi.org/10.4251/wjgo.v11.i3.181


