Copyright
©The Author(s) 2019.
World J Gastrointest Oncol. Mar 15, 2019; 11(3): 181-194
Published online Mar 15, 2019. doi: 10.4251/wjgo.v11.i3.181
Published online Mar 15, 2019. doi: 10.4251/wjgo.v11.i3.181
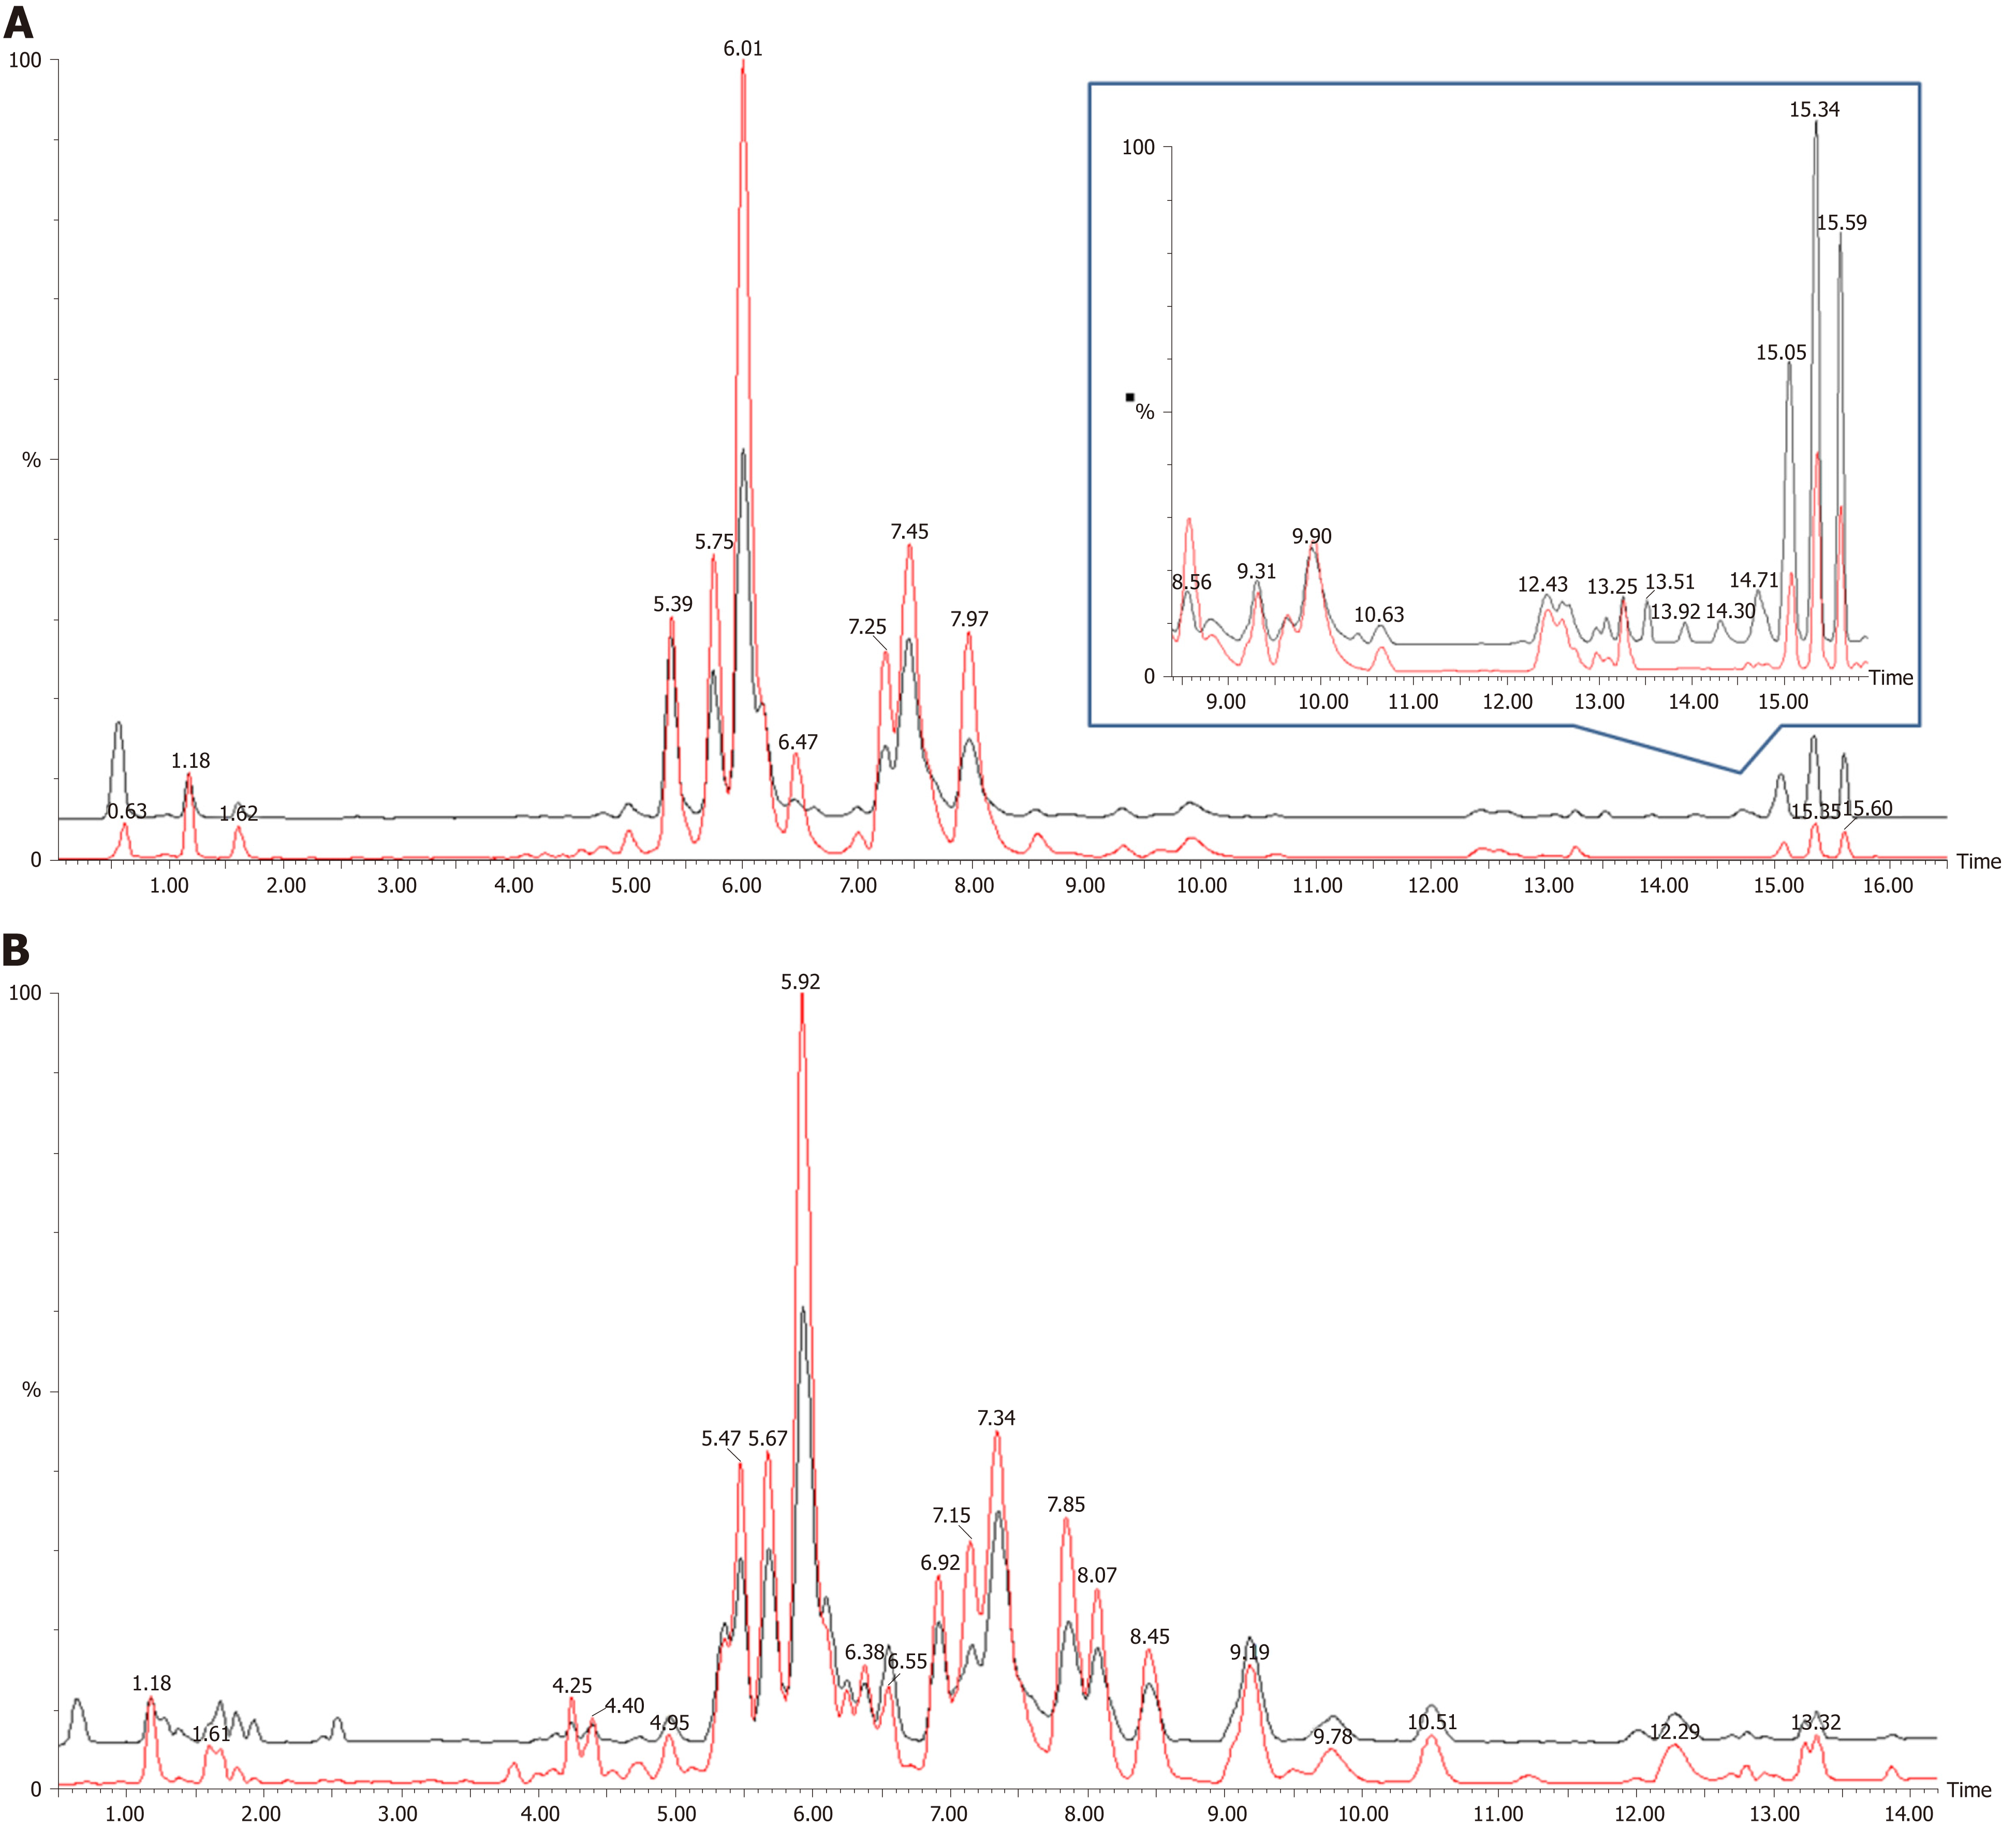
Figure 1 Different lipidomic profiling of gastric cancer tissues based on liquid chromatography/mass spectrometry analysis.
A: Electrospray ionization (ESI) positive modes; B: ESI negative modes. Base peak chromatograms of the gastric cancer samples are shown from the different groups. Red represents for the gastric cancer tissues (NO. 38); Black represents for the adjacent non-cancerous tissues as a control.
- Citation: Hung CY, Yeh TS, Tsai CK, Wu RC, Lai YC, Chiang MH, Lu KY, Lin CN, Cheng ML, Lin G. Glycerophospholipids pathways and chromosomal instability in gastric cancer: Global lipidomics analysis. World J Gastrointest Oncol 2019; 11(3): 181-194
- URL: https://www.wjgnet.com/1948-5204/full/v11/i3/181.htm
- DOI: https://dx.doi.org/10.4251/wjgo.v11.i3.181


