
















©The Author(s) 2019.
World J Gastrointest Oncol. Dec 15, 2019; 11(12): 1193-1205
Published online Dec 15, 2019. doi: 10.4251/wjgo.v11.i12.1193
Published online Dec 15, 2019. doi: 10.4251/wjgo.v11.i12.1193
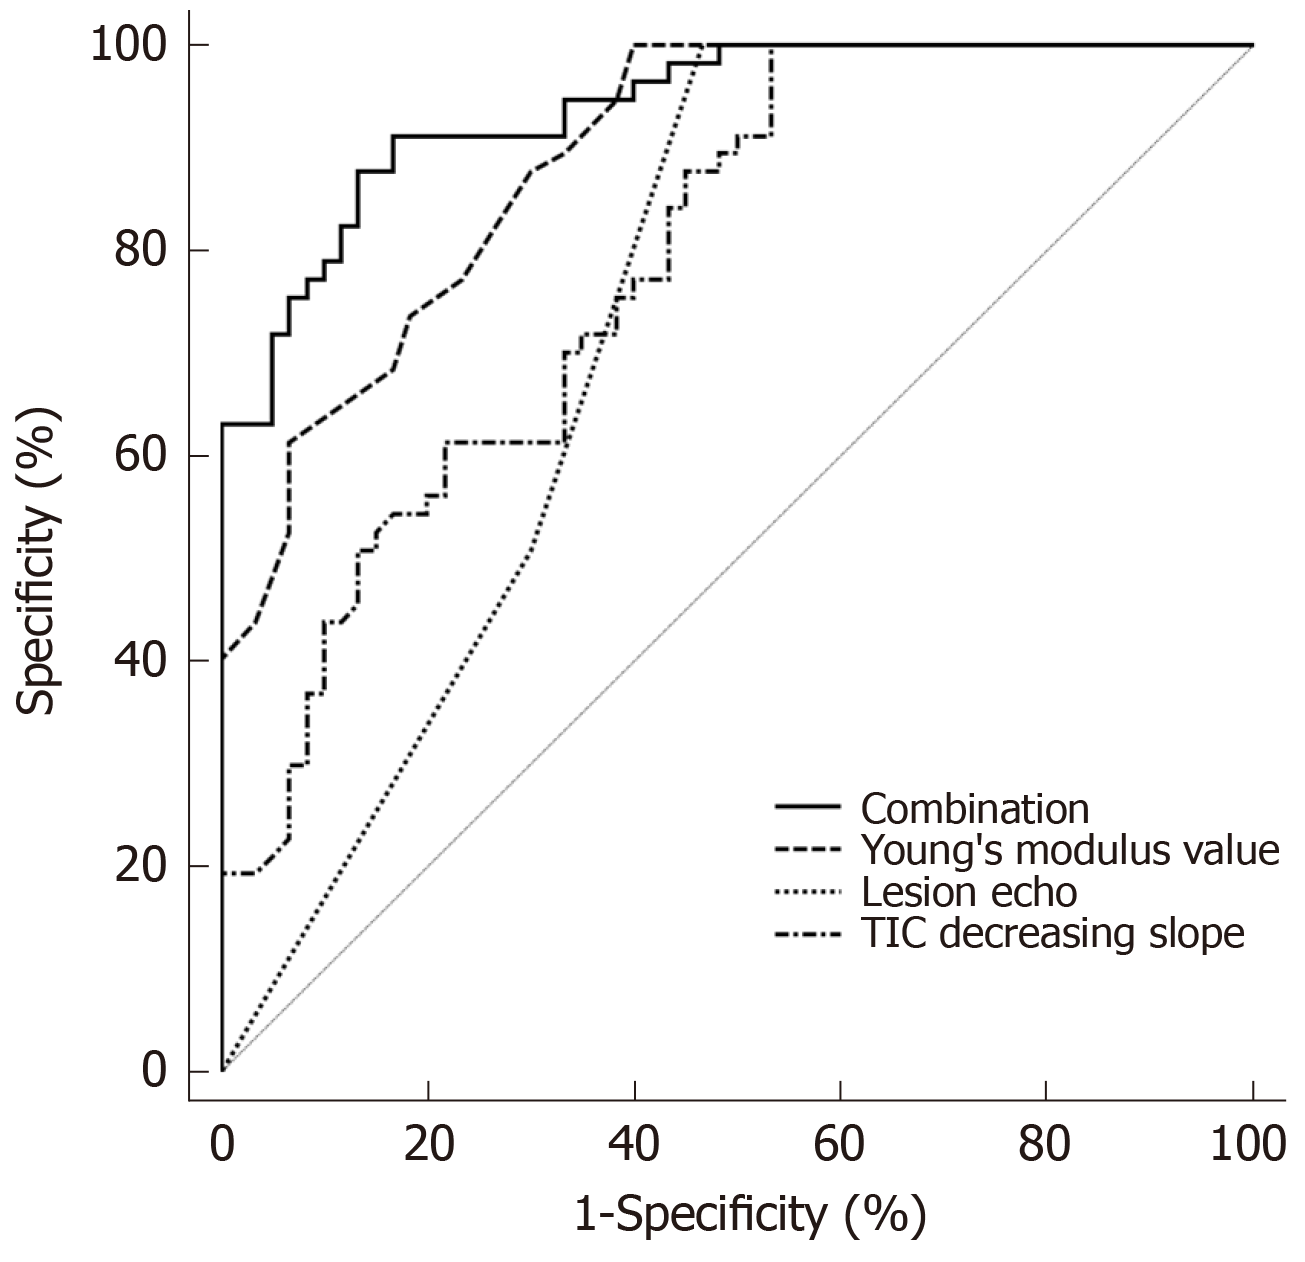
Figure 2 ROC curve analysis of Young's modulus value, time intense curve decreasing slope, lesion echo and their combination in the differential diagnosis of hepatocellular adenoma and focal nodular hyperplasia.
- Citation: Wu M, Zhou RH, Xu F, Li XP, Zhao P, Yuan R, Lan YP, Zhou WX. Multi-parameter ultrasound based on the logistic regression model in the differential diagnosis of hepatocellular adenoma and focal nodular hyperplasia. World J Gastrointest Oncol 2019; 11(12): 1193-1205
- URL: https://www.wjgnet.com/1948-5204/full/v11/i12/1193.htm
- DOI: https://dx.doi.org/10.4251/wjgo.v11.i12.1193