Copyright
©The Author(s) 2019.
World J Gastrointest Oncol. Dec 15, 2019; 11(12): 1182-1192
Published online Dec 15, 2019. doi: 10.4251/wjgo.v11.i12.1182
Published online Dec 15, 2019. doi: 10.4251/wjgo.v11.i12.1182
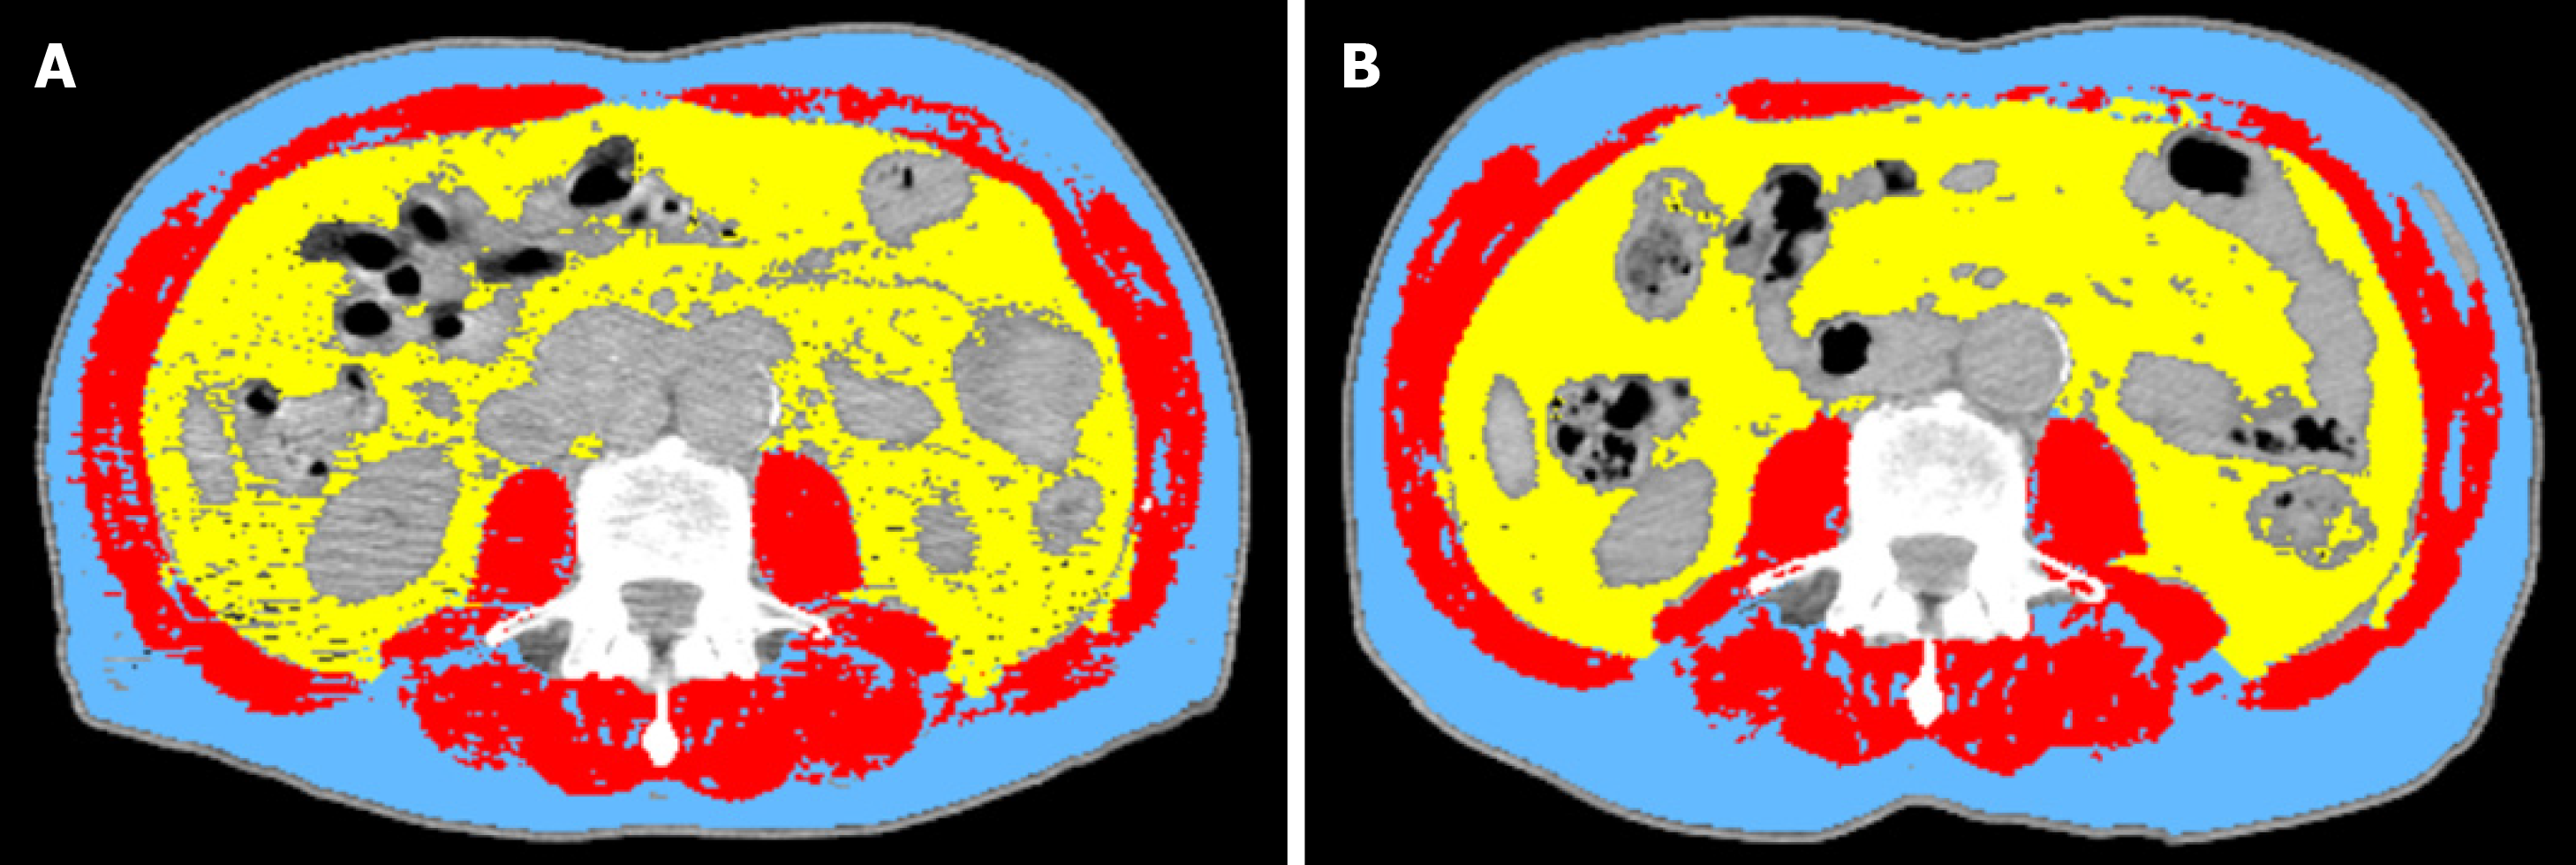
Figure 1 Radiologic image showing a comparison of body composition at diagnosis (A) and post neo-adjuvant (B) chemotherapy (two computed tomography scans of the third lumbar vertebra skeletal mass) for the same patient.
Red: Muscle; Yellow: Visceral fat; Blue: Subcutaneous fat.
- Citation: Mohamed IM, Whiting J, Tan BH. Impact of regular enteral feeding via jejunostomy during neo-adjuvant chemotherapy on body composition in patients with oesophageal cancer. World J Gastrointest Oncol 2019; 11(12): 1182-1192
- URL: https://www.wjgnet.com/1948-5204/full/v11/i12/1182.htm
- DOI: https://dx.doi.org/10.4251/wjgo.v11.i12.1182


