Copyright
©The Author(s) 2019.
World J Gastrointest Oncol. Oct 15, 2019; 11(10): 877-886
Published online Oct 15, 2019. doi: 10.4251/wjgo.v11.i10.877
Published online Oct 15, 2019. doi: 10.4251/wjgo.v11.i10.877
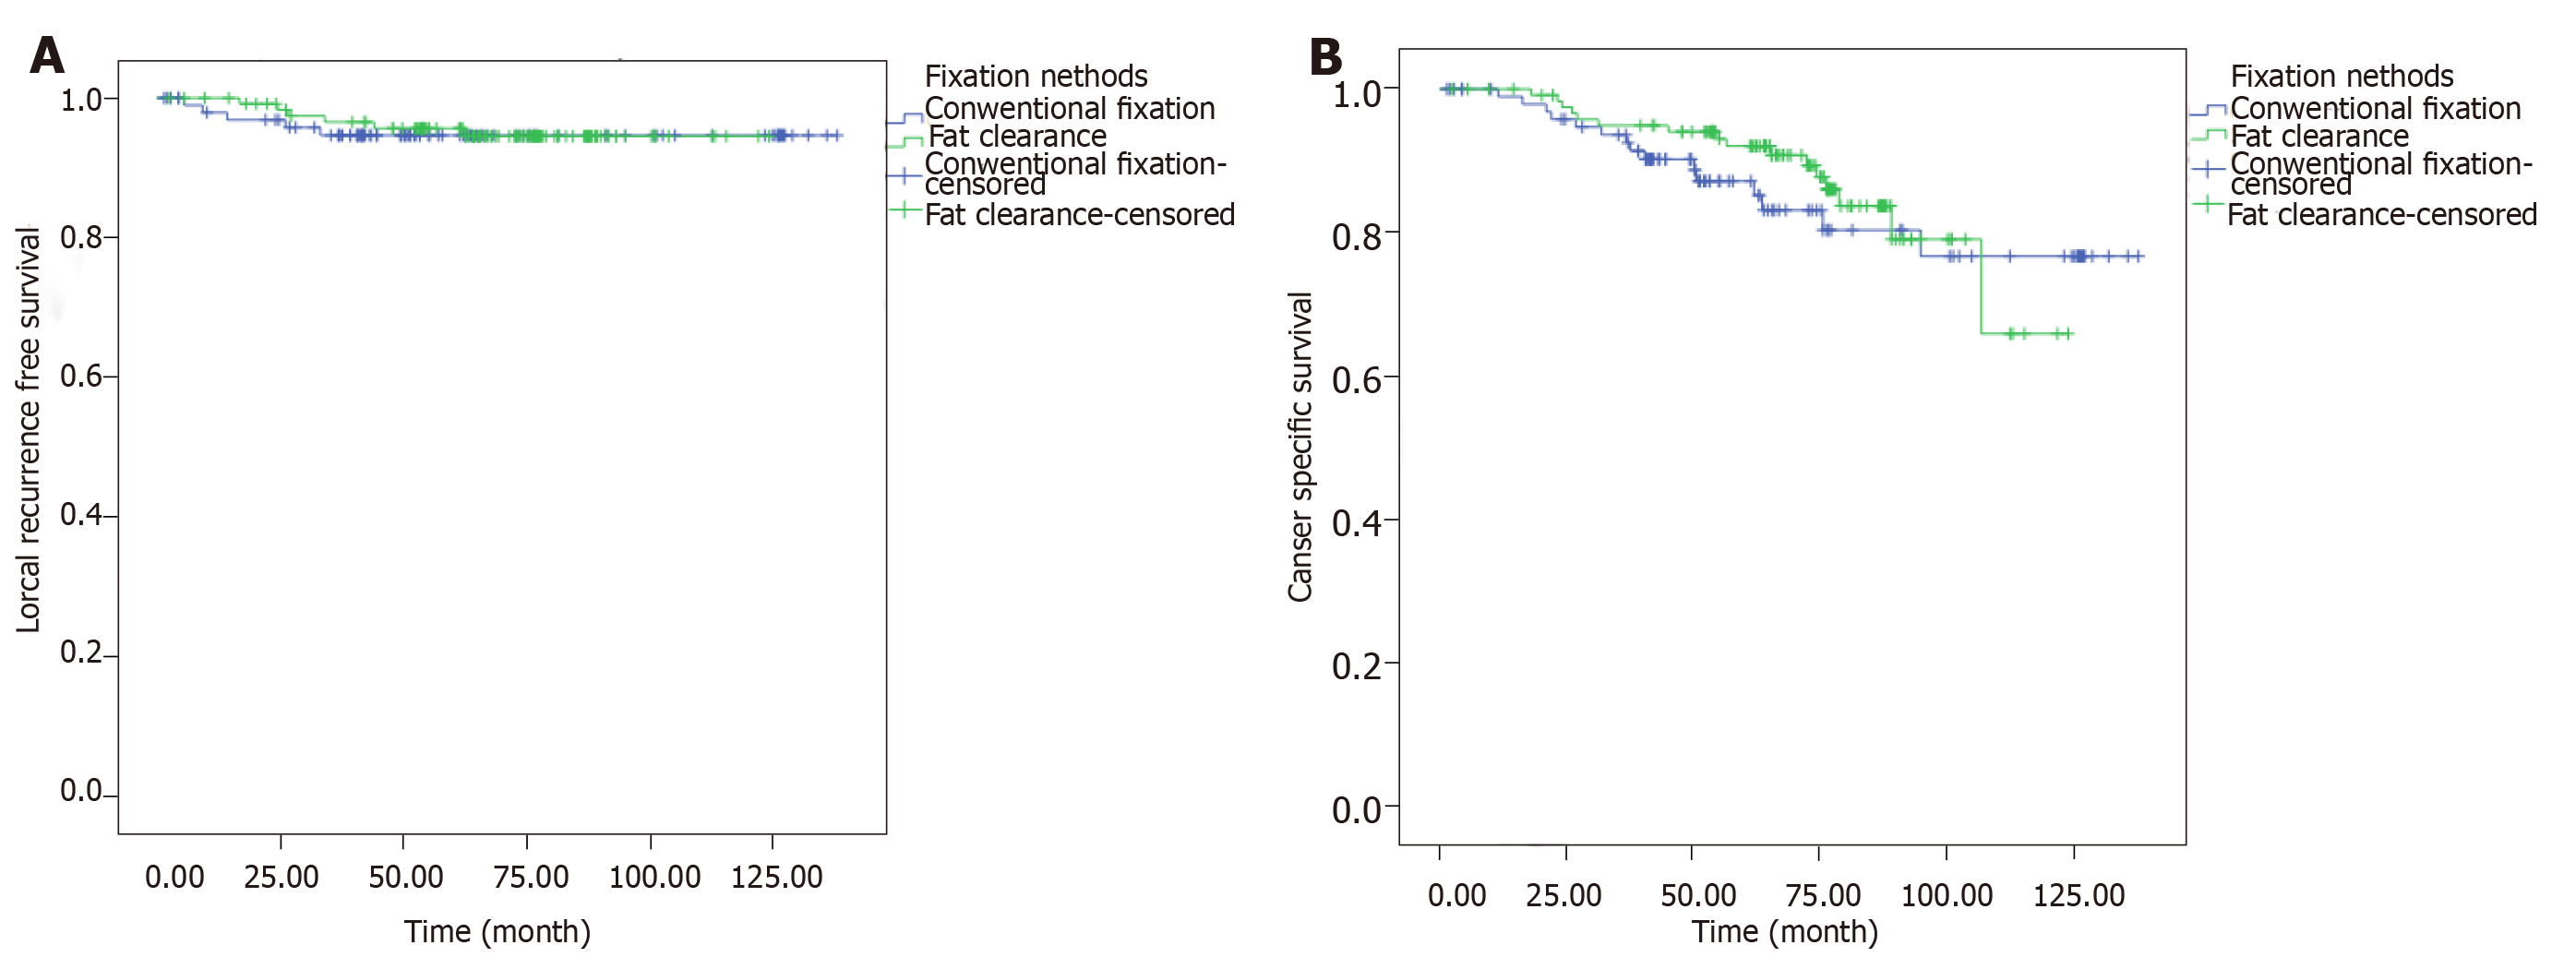
Figure 3 Kaplan–Meier curves.
A: The Kaplan–Meier curve of local recurrence-free survival (LRFS): the estimated 5-year LRFS rates were 95.7% and 94.6% in fat clearance (FC) and conventional fixation (CF) groups, respectively (P = 0.819); B: The Kaplan–Meier curve of cancer-specific survival (CSS): the estimated 5-year CSS rates were 92.0% and 87.2% in FC and CF groups, respectively (P = 0.482).
- Citation: Chen N, Sun TT, Li ZW, Yao YF, Wang L, Wu AW. Fat clearance and conventional fixation identified ypN0 rectal cancers following intermediate neoadjuvant radiotherapy have similar long-term outcomes. World J Gastrointest Oncol 2019; 11(10): 877-886
- URL: https://www.wjgnet.com/1948-5204/full/v11/i10/877.htm
- DOI: https://dx.doi.org/10.4251/wjgo.v11.i10.877


