Copyright
©The Author(s) 2019.
World J Gastrointest Oncol. Oct 15, 2019; 11(10): 842-856
Published online Oct 15, 2019. doi: 10.4251/wjgo.v11.i10.842
Published online Oct 15, 2019. doi: 10.4251/wjgo.v11.i10.842
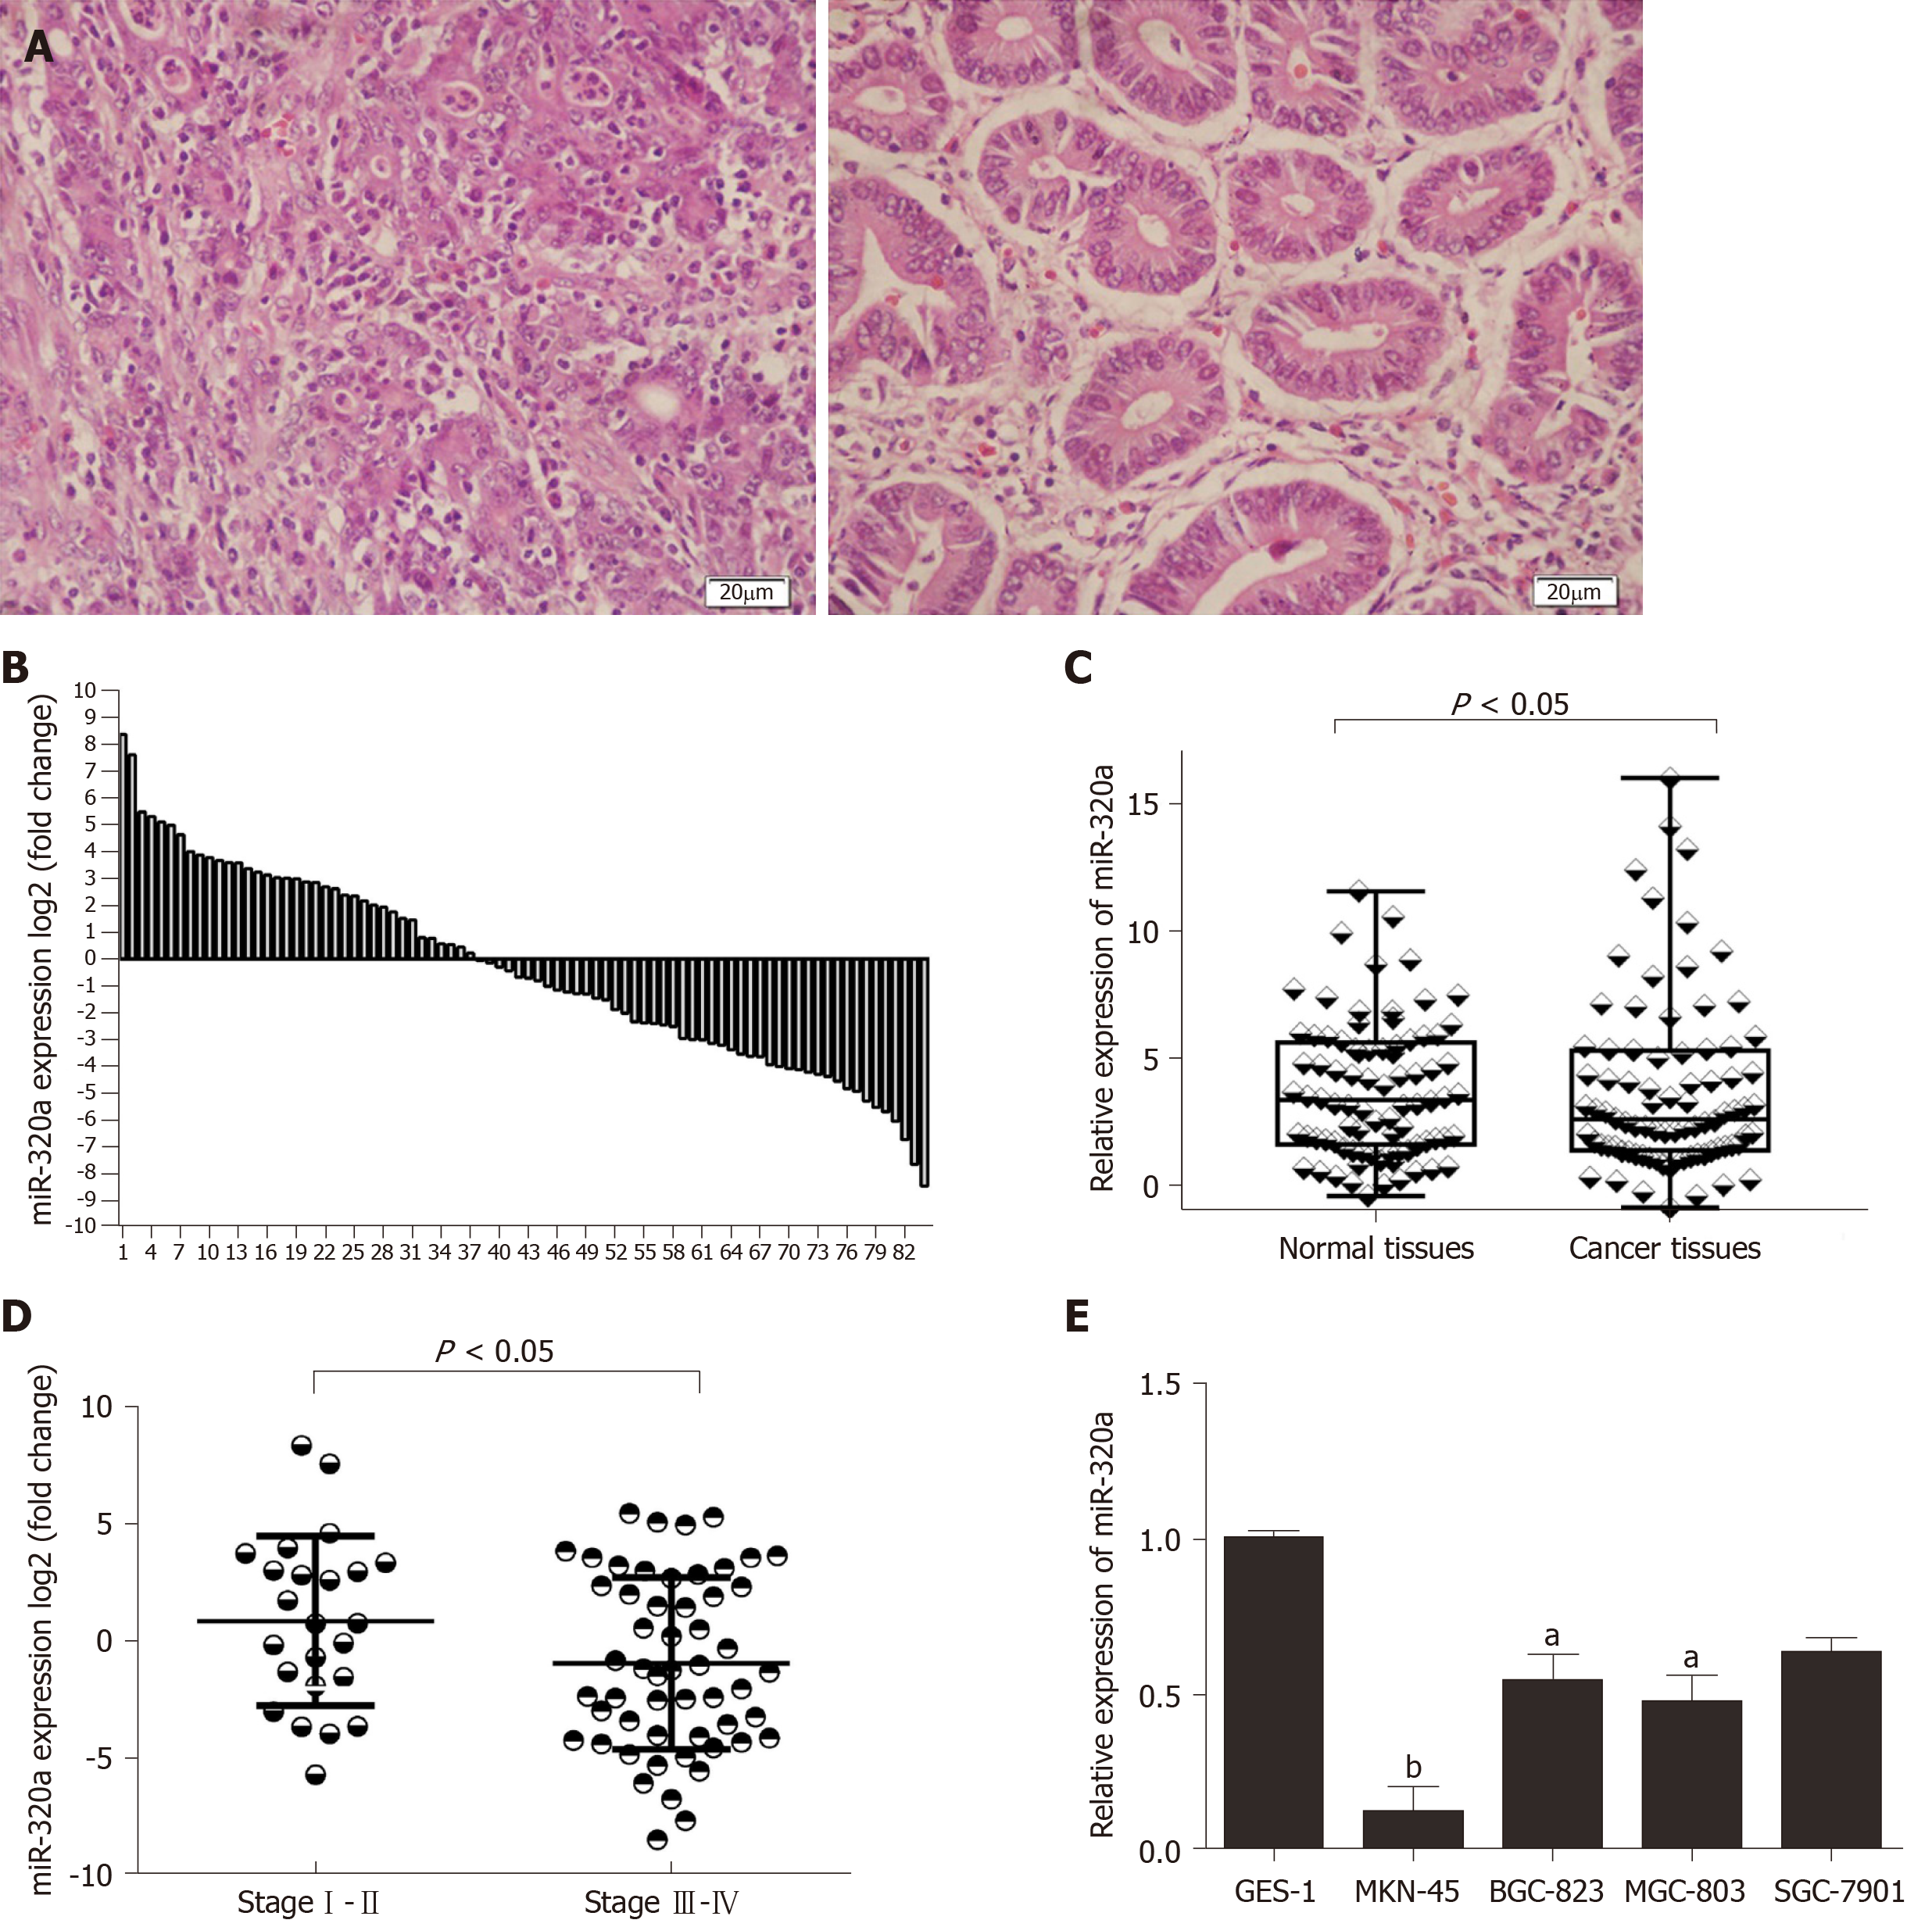
Figure 1 Expression of miR-320a in gastric cancer samples and cell lines, and miR-320a downregulation is correlated with tumor TNM stage.
A: Representative tissue slices from gastric cancer (GC) patients were stained using HE; scale bars 20 μm; B: miR-320a expression in 84 pairs of GC tissues and adjacent nontumor tissues is presented as log2 of fold change. Expression of miR-320a in these 84 pairs of samples was determined by quantitative PCR; C: Comparison of expression of miR-320a in GC tissues and matched normal tissues (P < 0.05); D: mir-320a expression in stage I/II (n = 23) and stage III/IV (n = 54) and the results are shown as log2 of fold change in GC tissues relative to normal tissues (P < 0.05); E: Expression of miR-320a in GES-1 and GC cell lines (MKN-45, BGC-823, MGC-803 and SGC-7901). aP < 0.05, bP < 0.01. The reference genes were set using U6 snRNA. All the experiments were conducted in triplicate. Data were analyzed by ANOVA or t test. The data are reported as means ± SD.
- Citation: Li YS, Zou Y, Dai DQ. MicroRNA-320a suppresses tumor progression by targeting PBX3 in gastric cancer and is downregulated by DNA methylation. World J Gastrointest Oncol 2019; 11(10): 842-856
- URL: https://www.wjgnet.com/1948-5204/full/v11/i10/842.htm
- DOI: https://dx.doi.org/10.4251/wjgo.v11.i10.842


