Copyright
©The Author(s) 2024.
World J Gastrointest Oncol. Apr 15, 2024; 16(4): 1626-1646
Published online Apr 15, 2024. doi: 10.4251/wjgo.v16.i4.1626
Published online Apr 15, 2024. doi: 10.4251/wjgo.v16.i4.1626
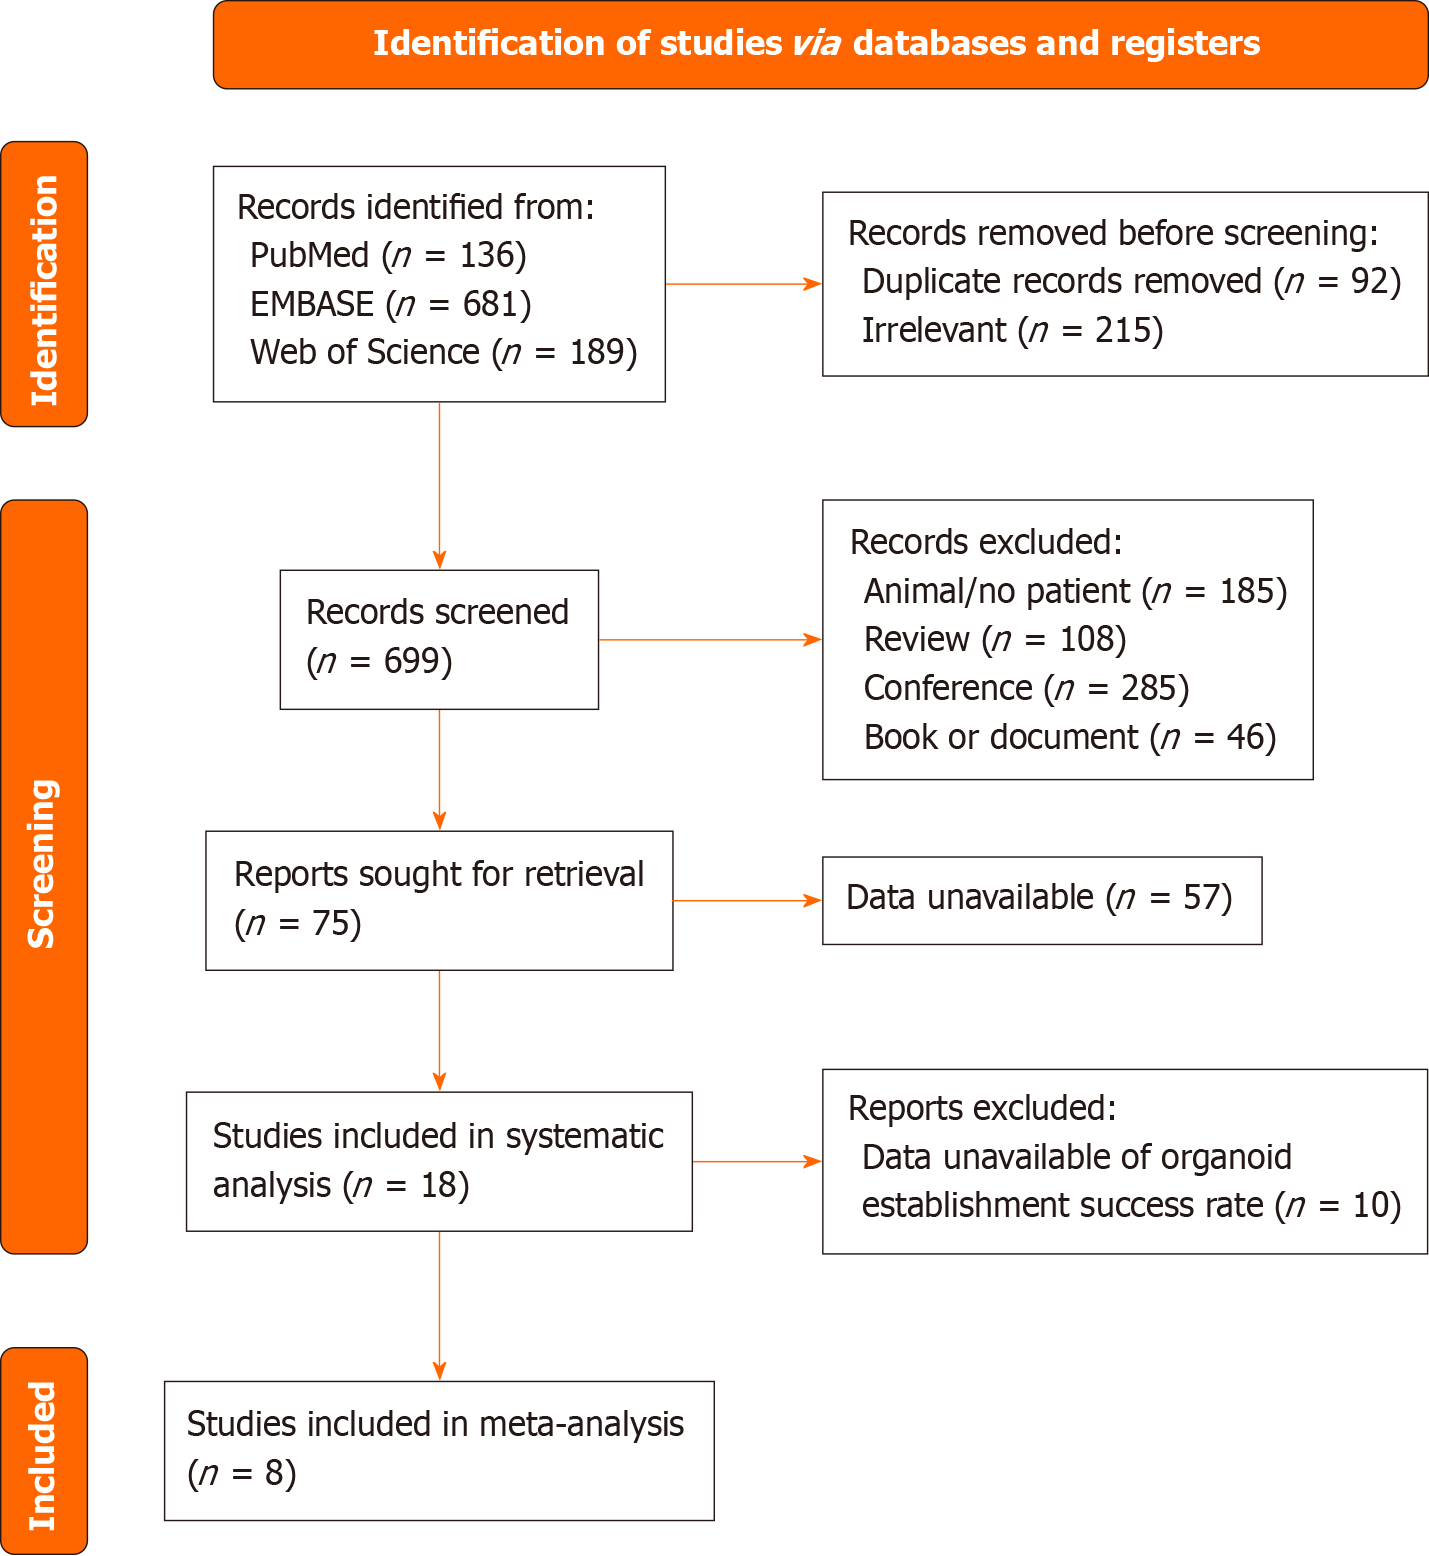
Figure 1 A flow diagram illustrating the screening process for studies eligible for meta-analysis.
Initially, 1006 records were identified, with 699 records screened after removing duplicates and irrelevant entries. After further exclusions based on criteria such as relevance and data availability, 75 reports were considered for retrieval. Ultimately, 18 studies were included in the systematic review, with 8 of these meeting the criteria for inclusion in the meta-analysis.
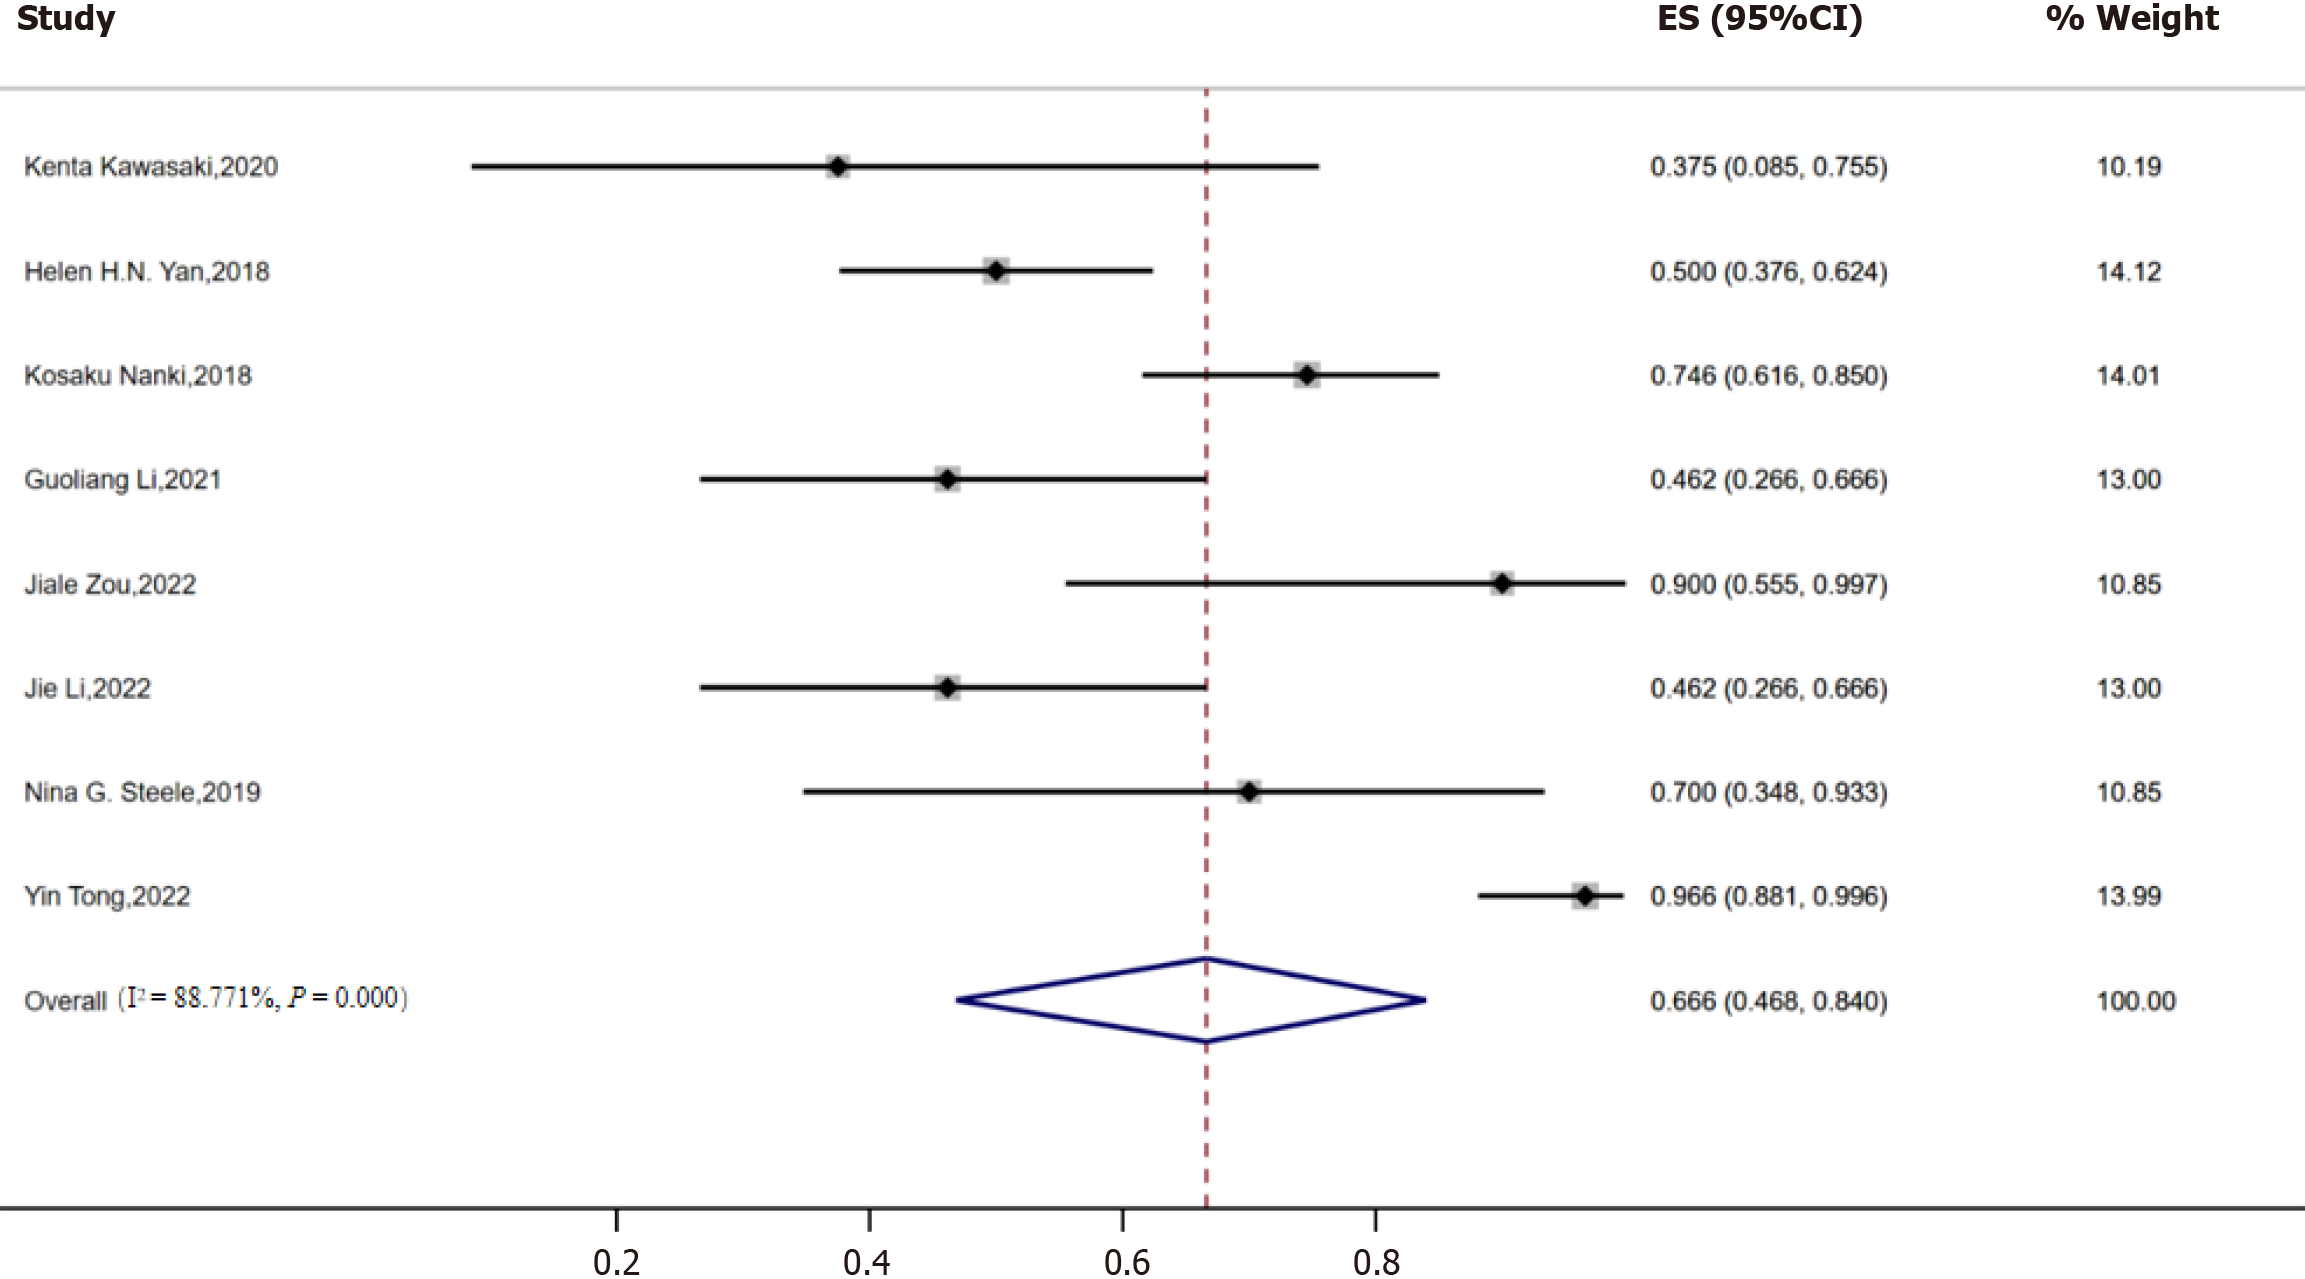
Figure 2 A forest plot showing the pooled successful gastric cancer organoid culture rate.
The plot indicates a pooled success rate of 66.6% with a 95% confidence interval: 0.468-0.840, I2 = 88.77%. ES: Effect size; CI: Confidence interval.
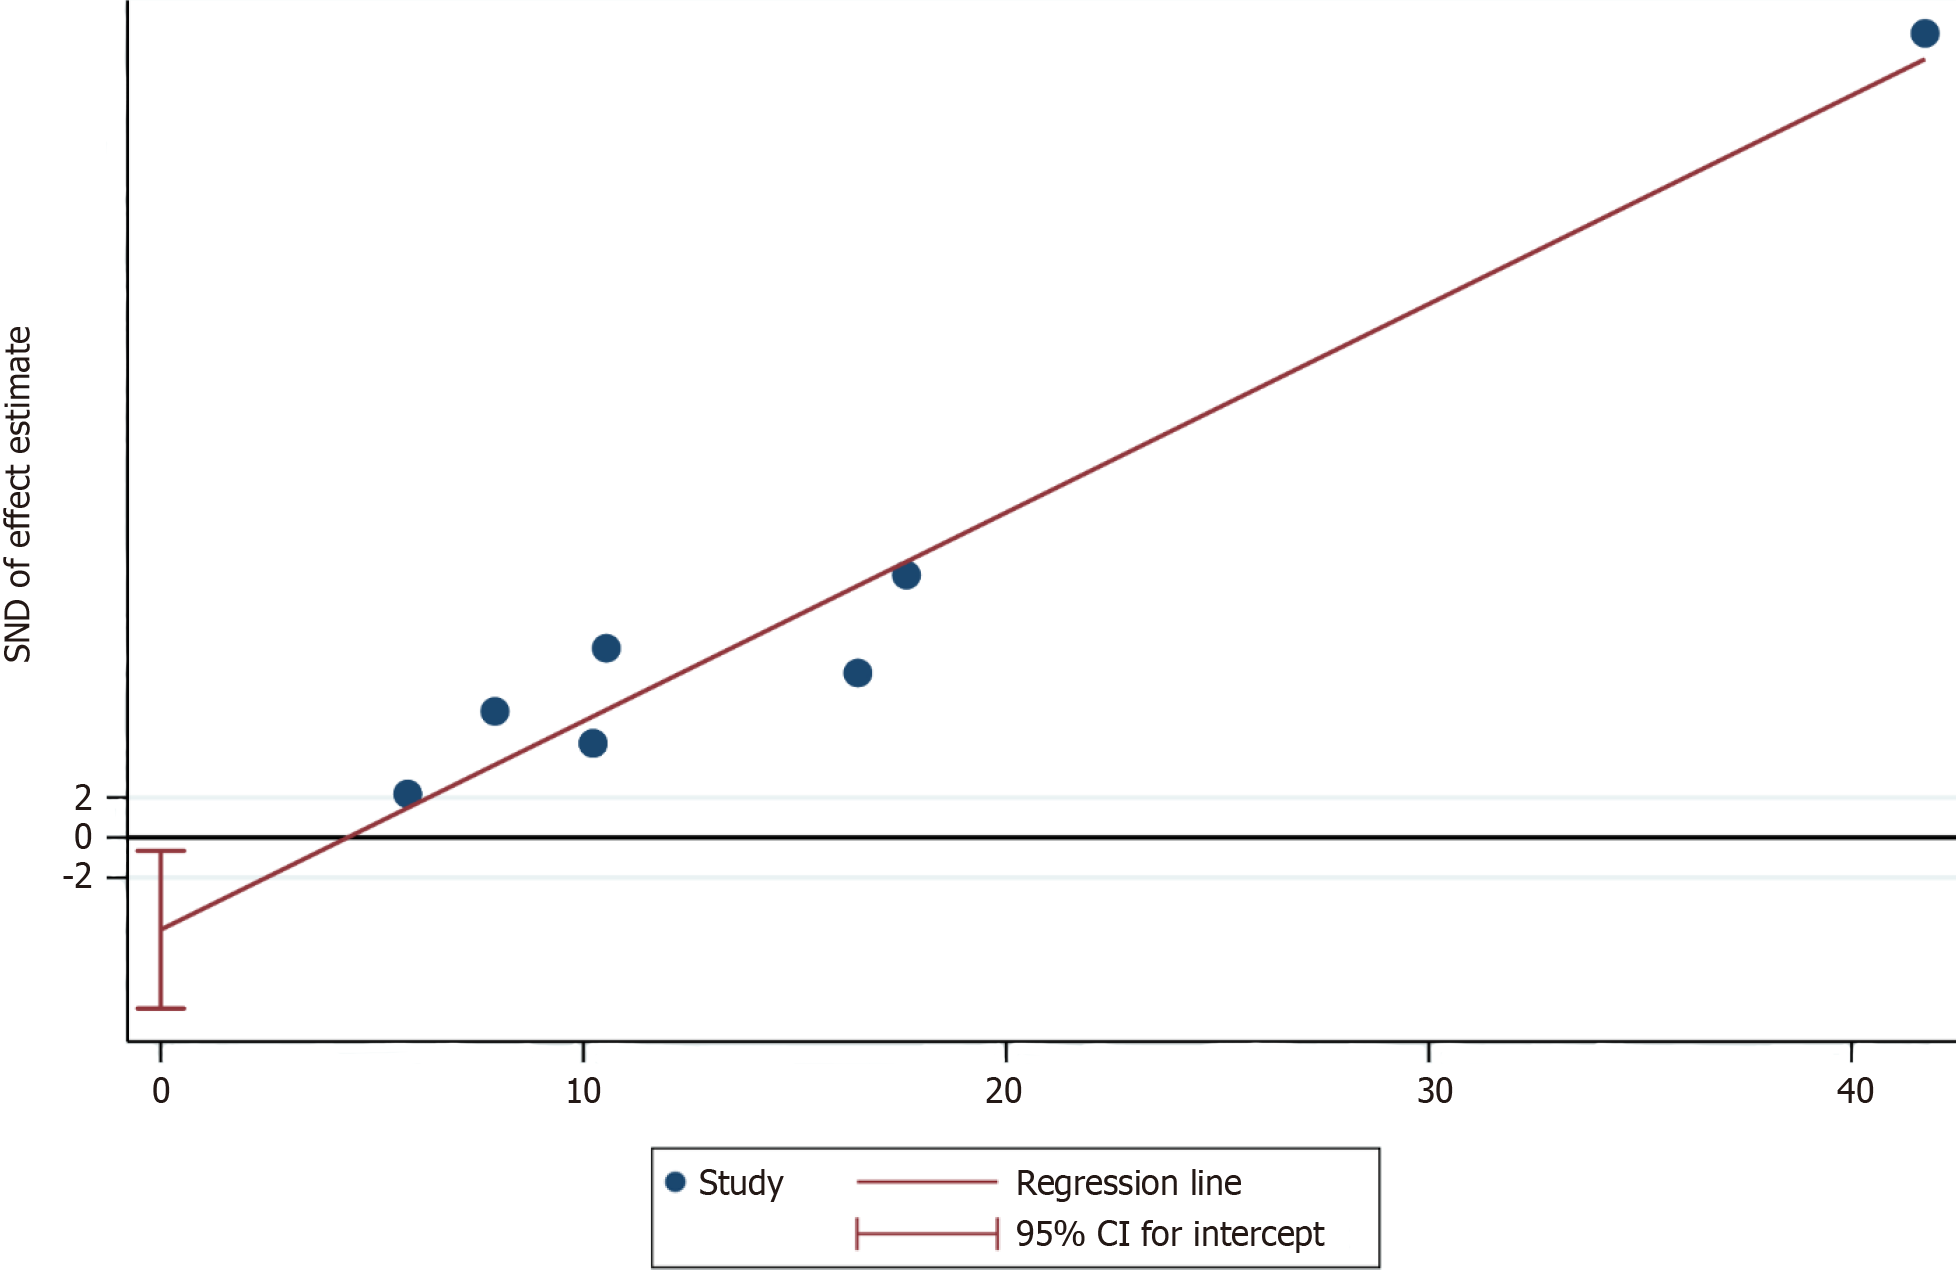
Figure 3 The funnel plot showed the presence publication bias.
The funnel plot showed the existence of publication bias. CI: Confidence interval; SND: Standardized normal deviate.
Figure 4 Forest plot of the pooled successful gastric cancer organoids culture rate according to different subgroups.
A: Gastric cancer organoids (GCOs) from female and male showed the success rate of 67.0, 95% confidence interval (CI): 31.1-95.7, and 46.7%, 95%CI: 31.5-62.2; B: GCOs from surgery or endoscopic submucosal dissection and biopsy showed a pooled success rate of 70.9%, 95%CI: 49.8-88.7 and 53.7%, 95%CI: 27.1-79.5; C: GCOs of poor-differentiated, moderate-differentiated and signet-ring cell cancer showed a pooled success establishment rate of 64.6, 95%CI: 46.0-81.3, 31.0, 95%CI: 6.3-61.3 and 32.7, 95%CI: 0.6-76.7; D: GCOs with pathological tumor-node-metastasis (pTNM) I-II and pTNM stage III-IV stage showed a pooled success establishment rate of 38.3, 95%CI: 4.1-79.1 and 65.2, 95%CI: 45.7-82.7. ES: Effect size; CI: Confidence interval.
Figure 5 Forest plot of the pooled successful gastric cancer organoids culture rate according to different growth factor.
A: Success rates with and without B27 supplementation: B27 group [68.7%, 95% confidence interval (CI): 46.9-83.3] vs non-B27 group (69.5%, 95%CI: 45.2-87.8) (P = 0.94); B-D: Success rates of gastric cancer organoids (GCOs) with N-acetylcystenine and gastrin but without nutlin-3 (71.9%, 95%CI: 38.2-96.2) compared to GCOs with nutlin-3 but without n-acetylcystenine and gastrin (71.5%, 95%CI: 59.3-82.3) (P = 0.95); E: Success rates of GCOs with fibroblast growth factor-2 (FGF-2) (67.4%, 95%CI: 21.6-99.2) compared to GCOs without FGF-2 (67.9%, 95%CI: 49.2-84.2) (P = 0.98); F: Success rates of GCOs with Y-27632 (58.2%, 95%CI: 41.6-75.0) compared to GCOs without Y-27632 (70.0%, 95%CI: 39.8-93.3) (P = 0.505). ES: Effect size; CI: Confidence interval; FGF-2: Fibroblast growth factor-2.
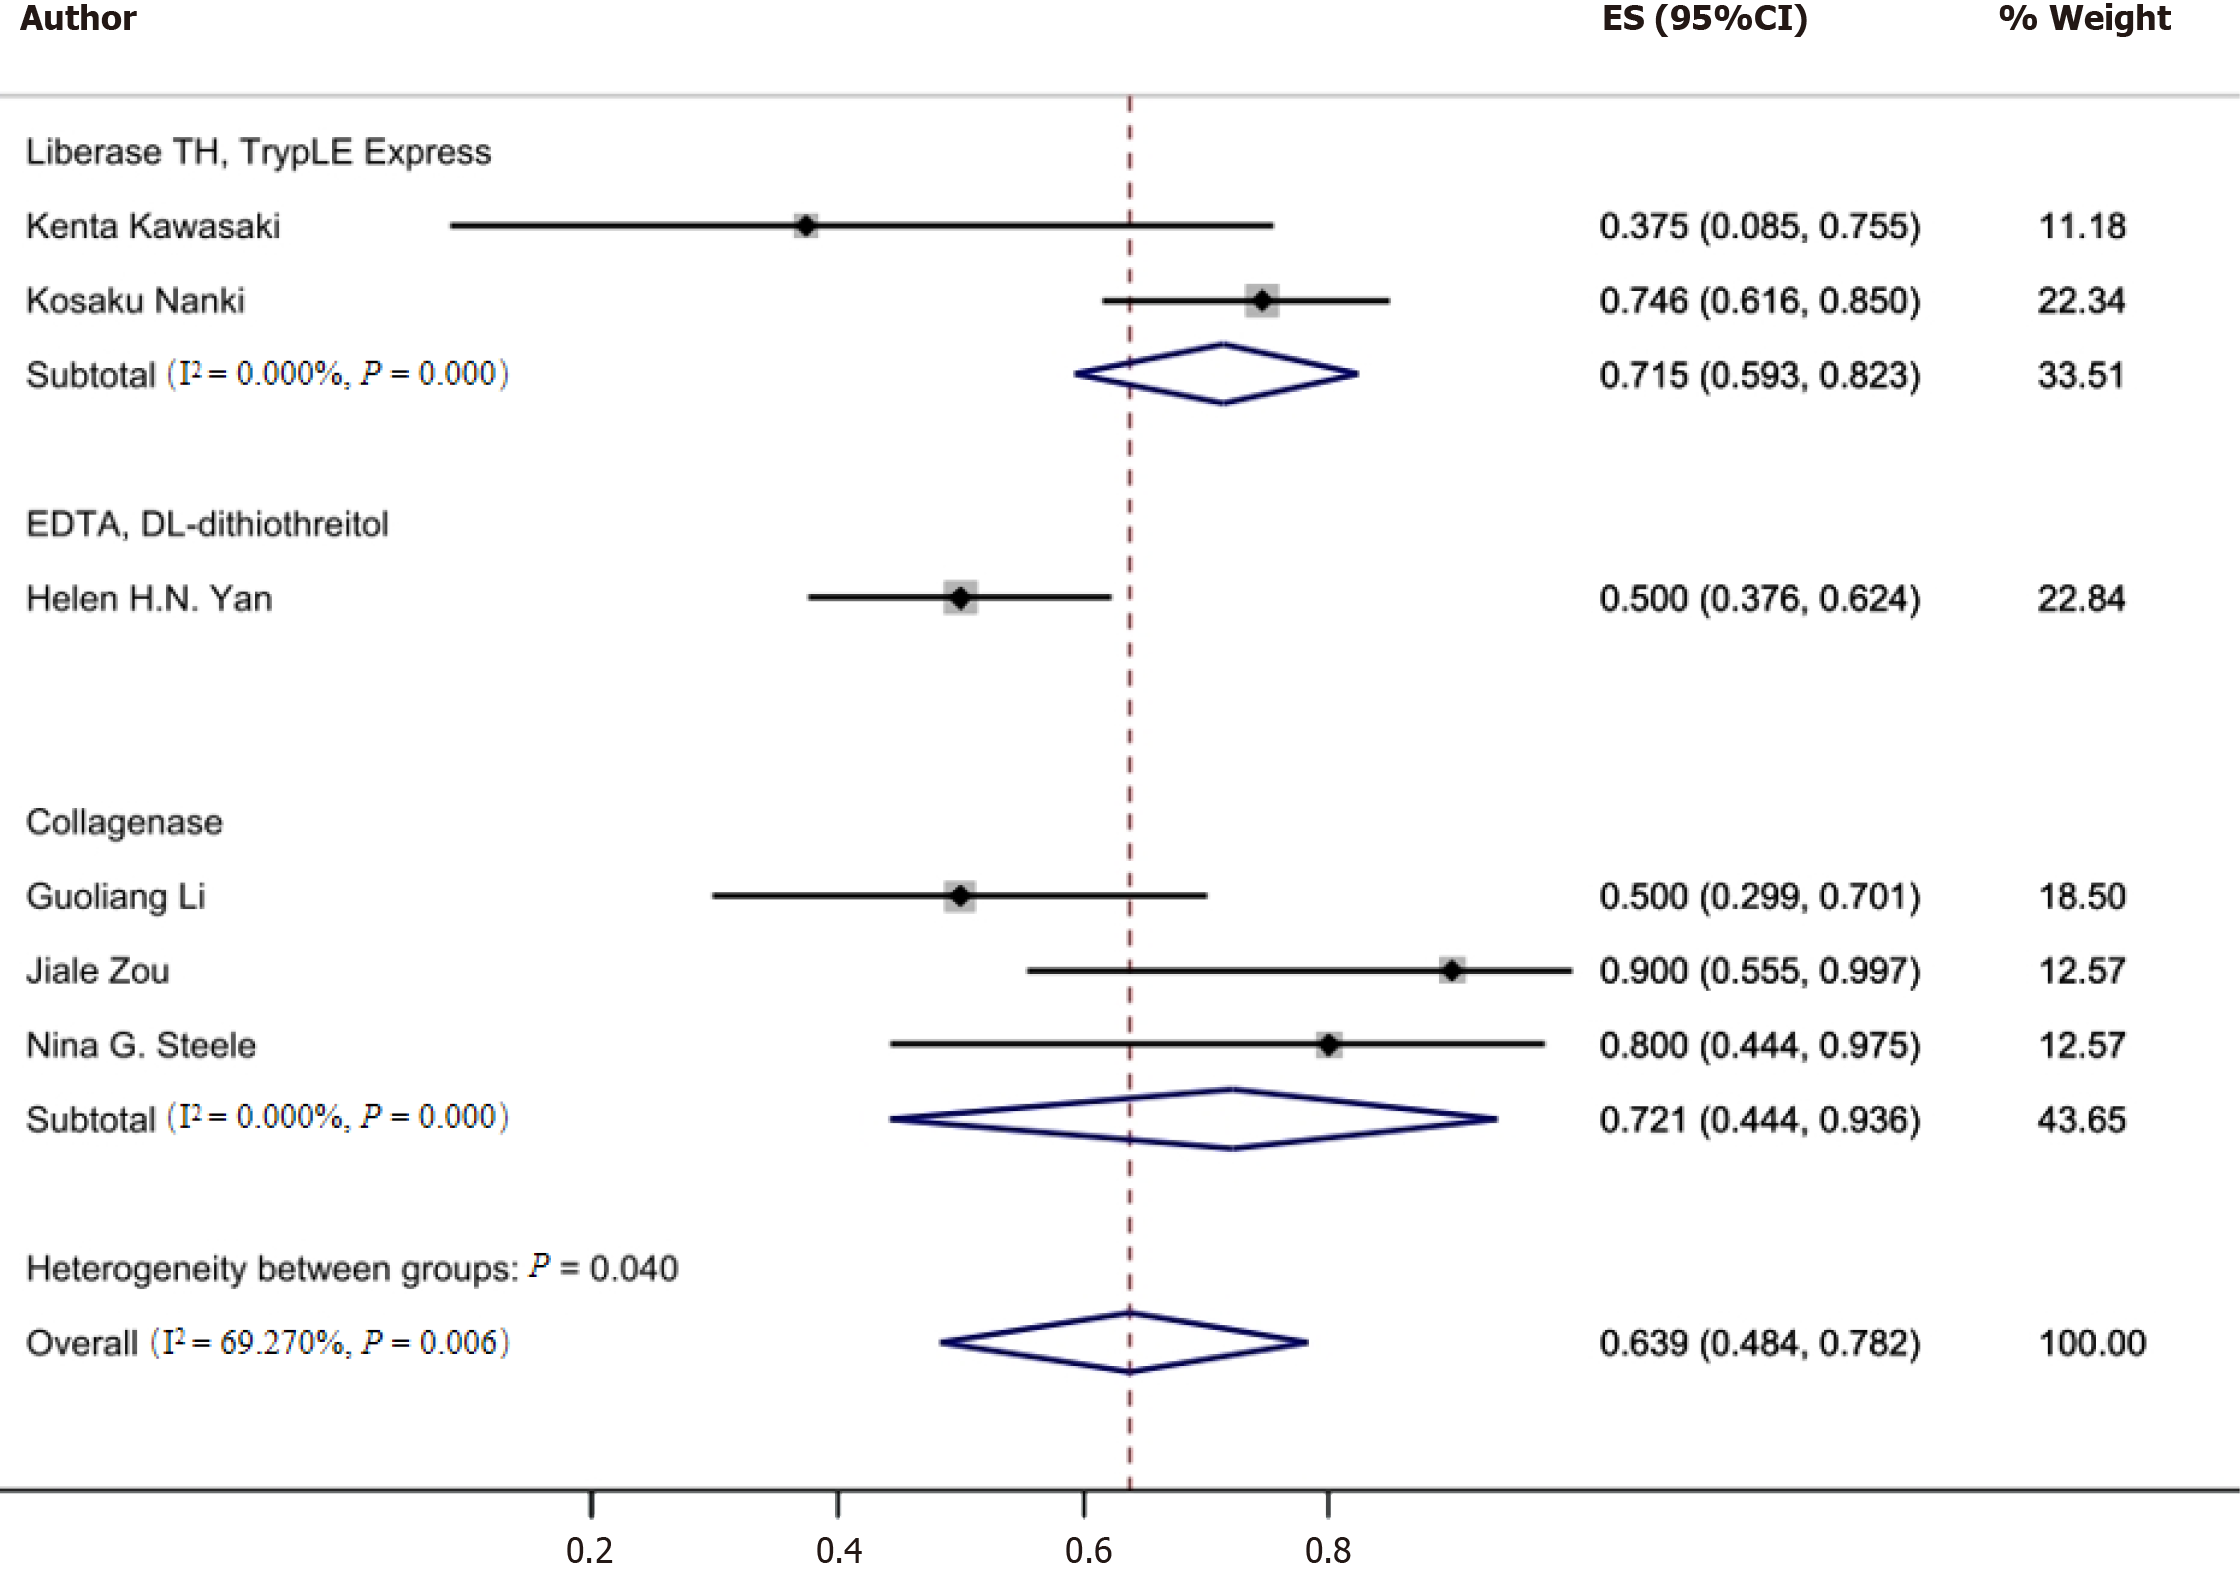
Figure 6 Forest plot of the pooled successful gastric cancer organoids culture rate according to different digestive enzyme.
Liberase TH and TrypLE digestion: Success rate 71% [95% confidence interval (CI): 59.3-82.3]. Collagenase digestion: Success rate 72.1% (95%CI: 44.4-93.6, P = 0.04). EDTA digestion: Success rate 50.0% (95%CI: 37.6-62.4, P = 0.04). ES: Effect size; CI: Confidence interval.
- Citation: Jiang KL, Wang XX, Liu XJ, Guo LK, Chen YQ, Jia QL, Yang KM, Ling JH. Success rate of current human-derived gastric cancer organoids establishment and influencing factors: A systematic review and meta-analysis. World J Gastrointest Oncol 2024; 16(4): 1626-1646
- URL: https://www.wjgnet.com/1948-5204/full/v16/i4/1626.htm
- DOI: https://dx.doi.org/10.4251/wjgo.v16.i4.1626


