Copyright
©The Author(s) 2024.
World J Gastrointest Oncol. Apr 15, 2024; 16(4): 1578-1595
Published online Apr 15, 2024. doi: 10.4251/wjgo.v16.i4.1578
Published online Apr 15, 2024. doi: 10.4251/wjgo.v16.i4.1578
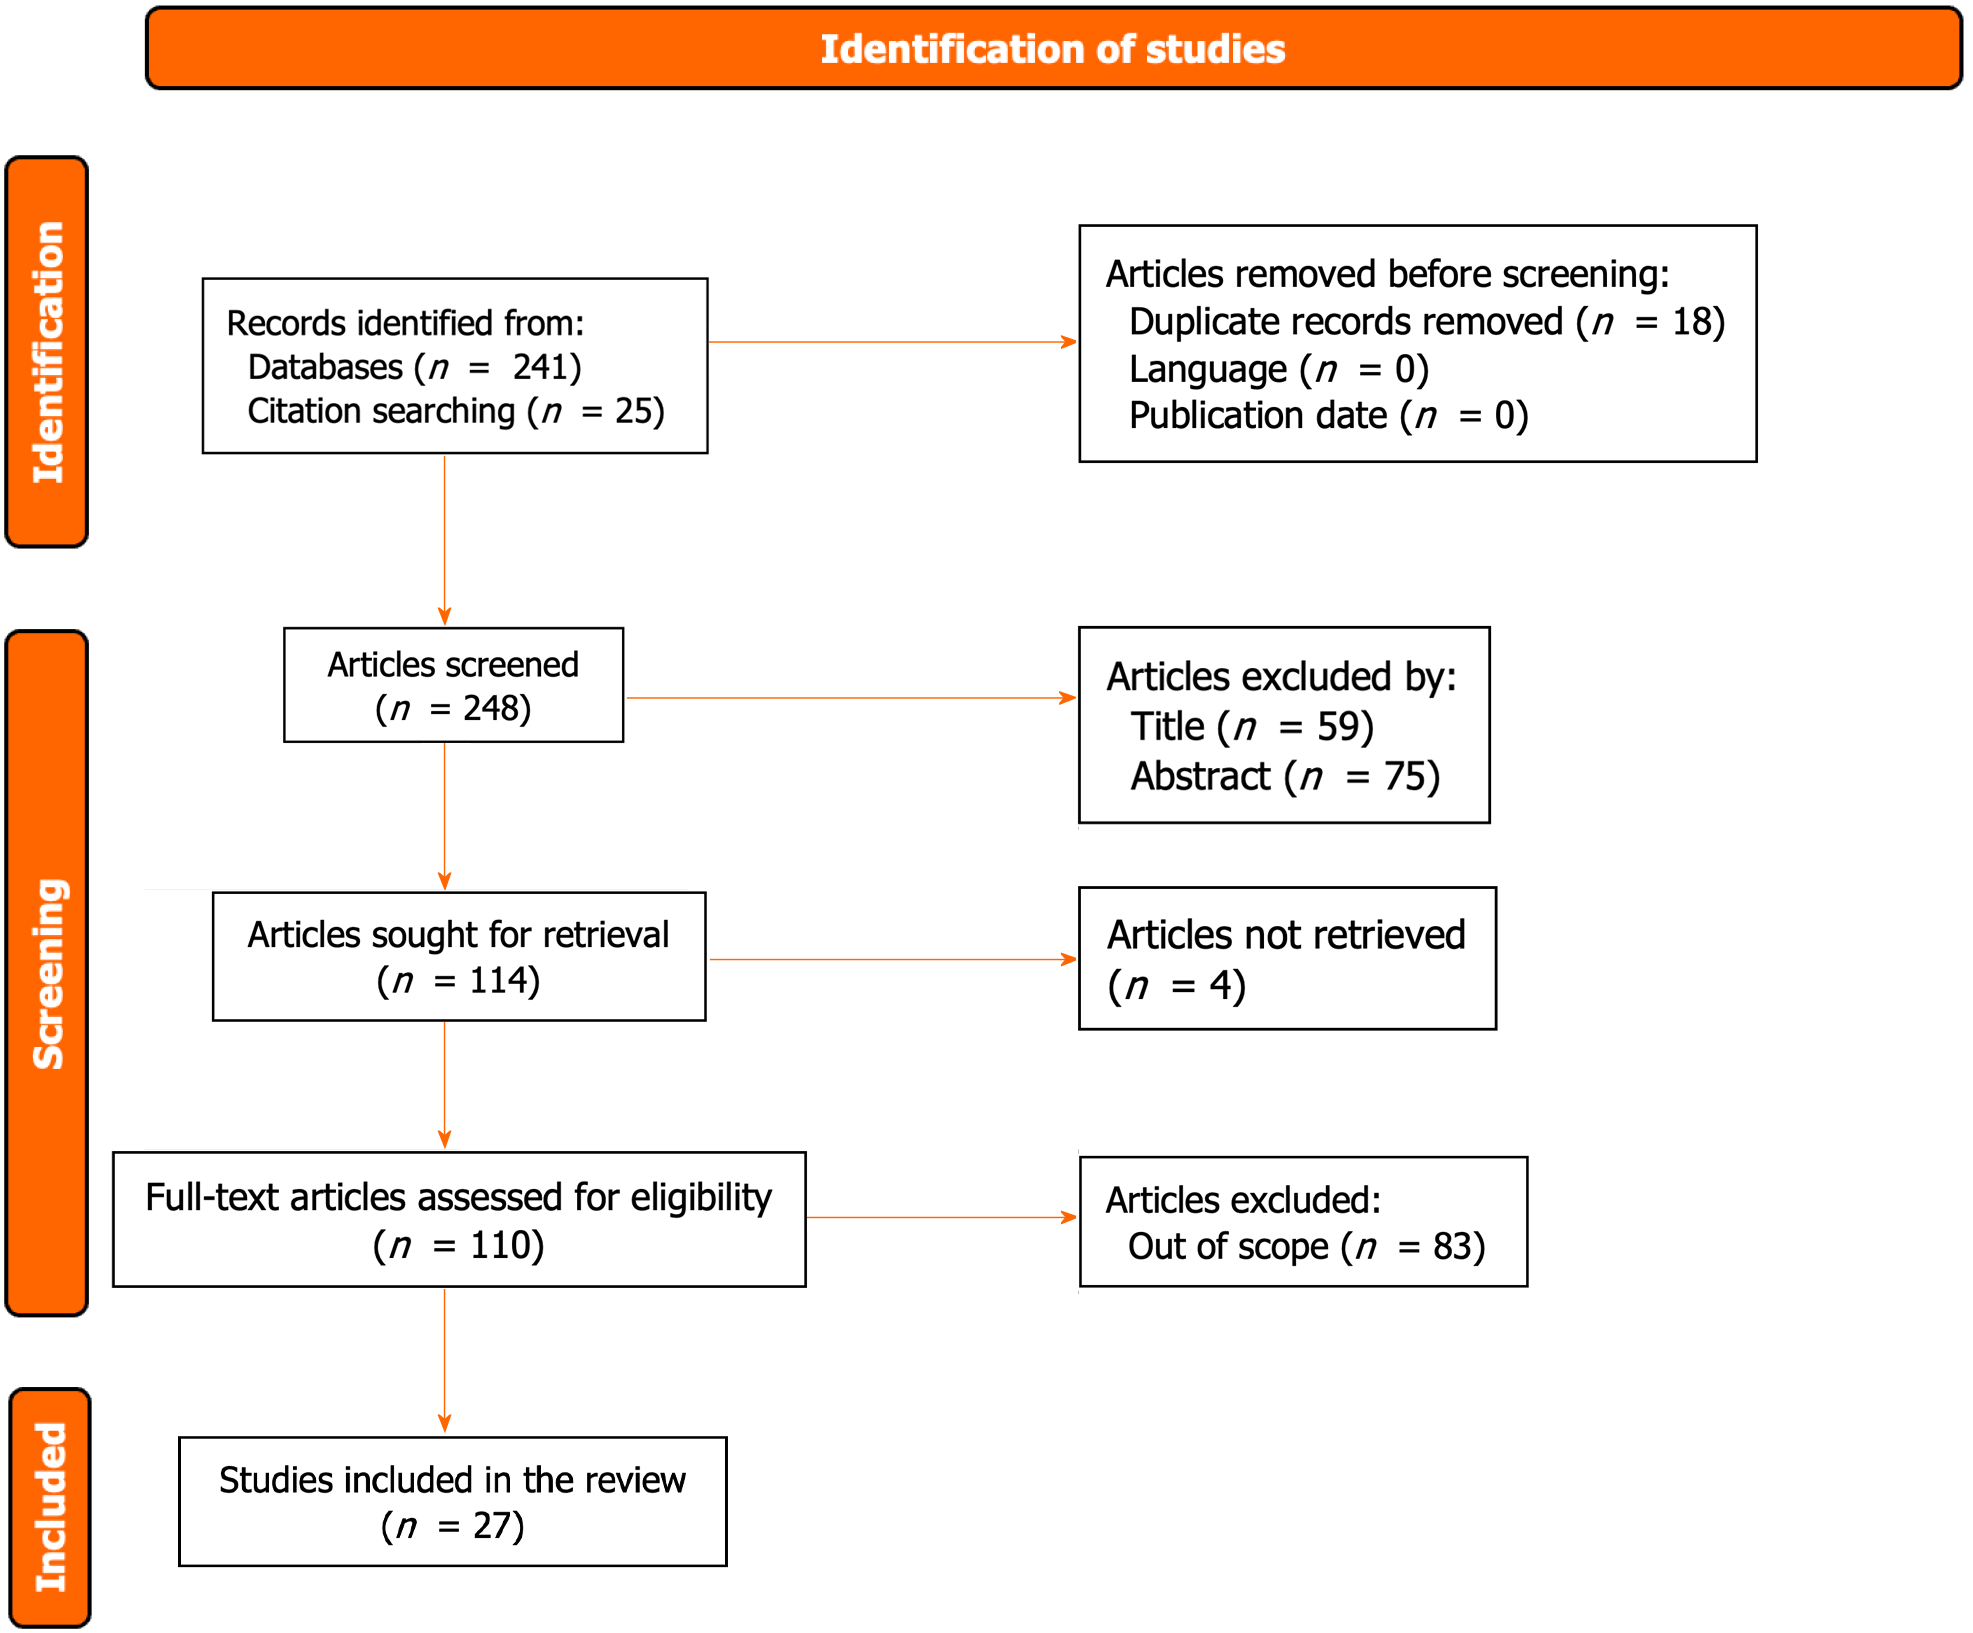
Figure 1 PRISMA flowchart of study inclusions and exclusions.
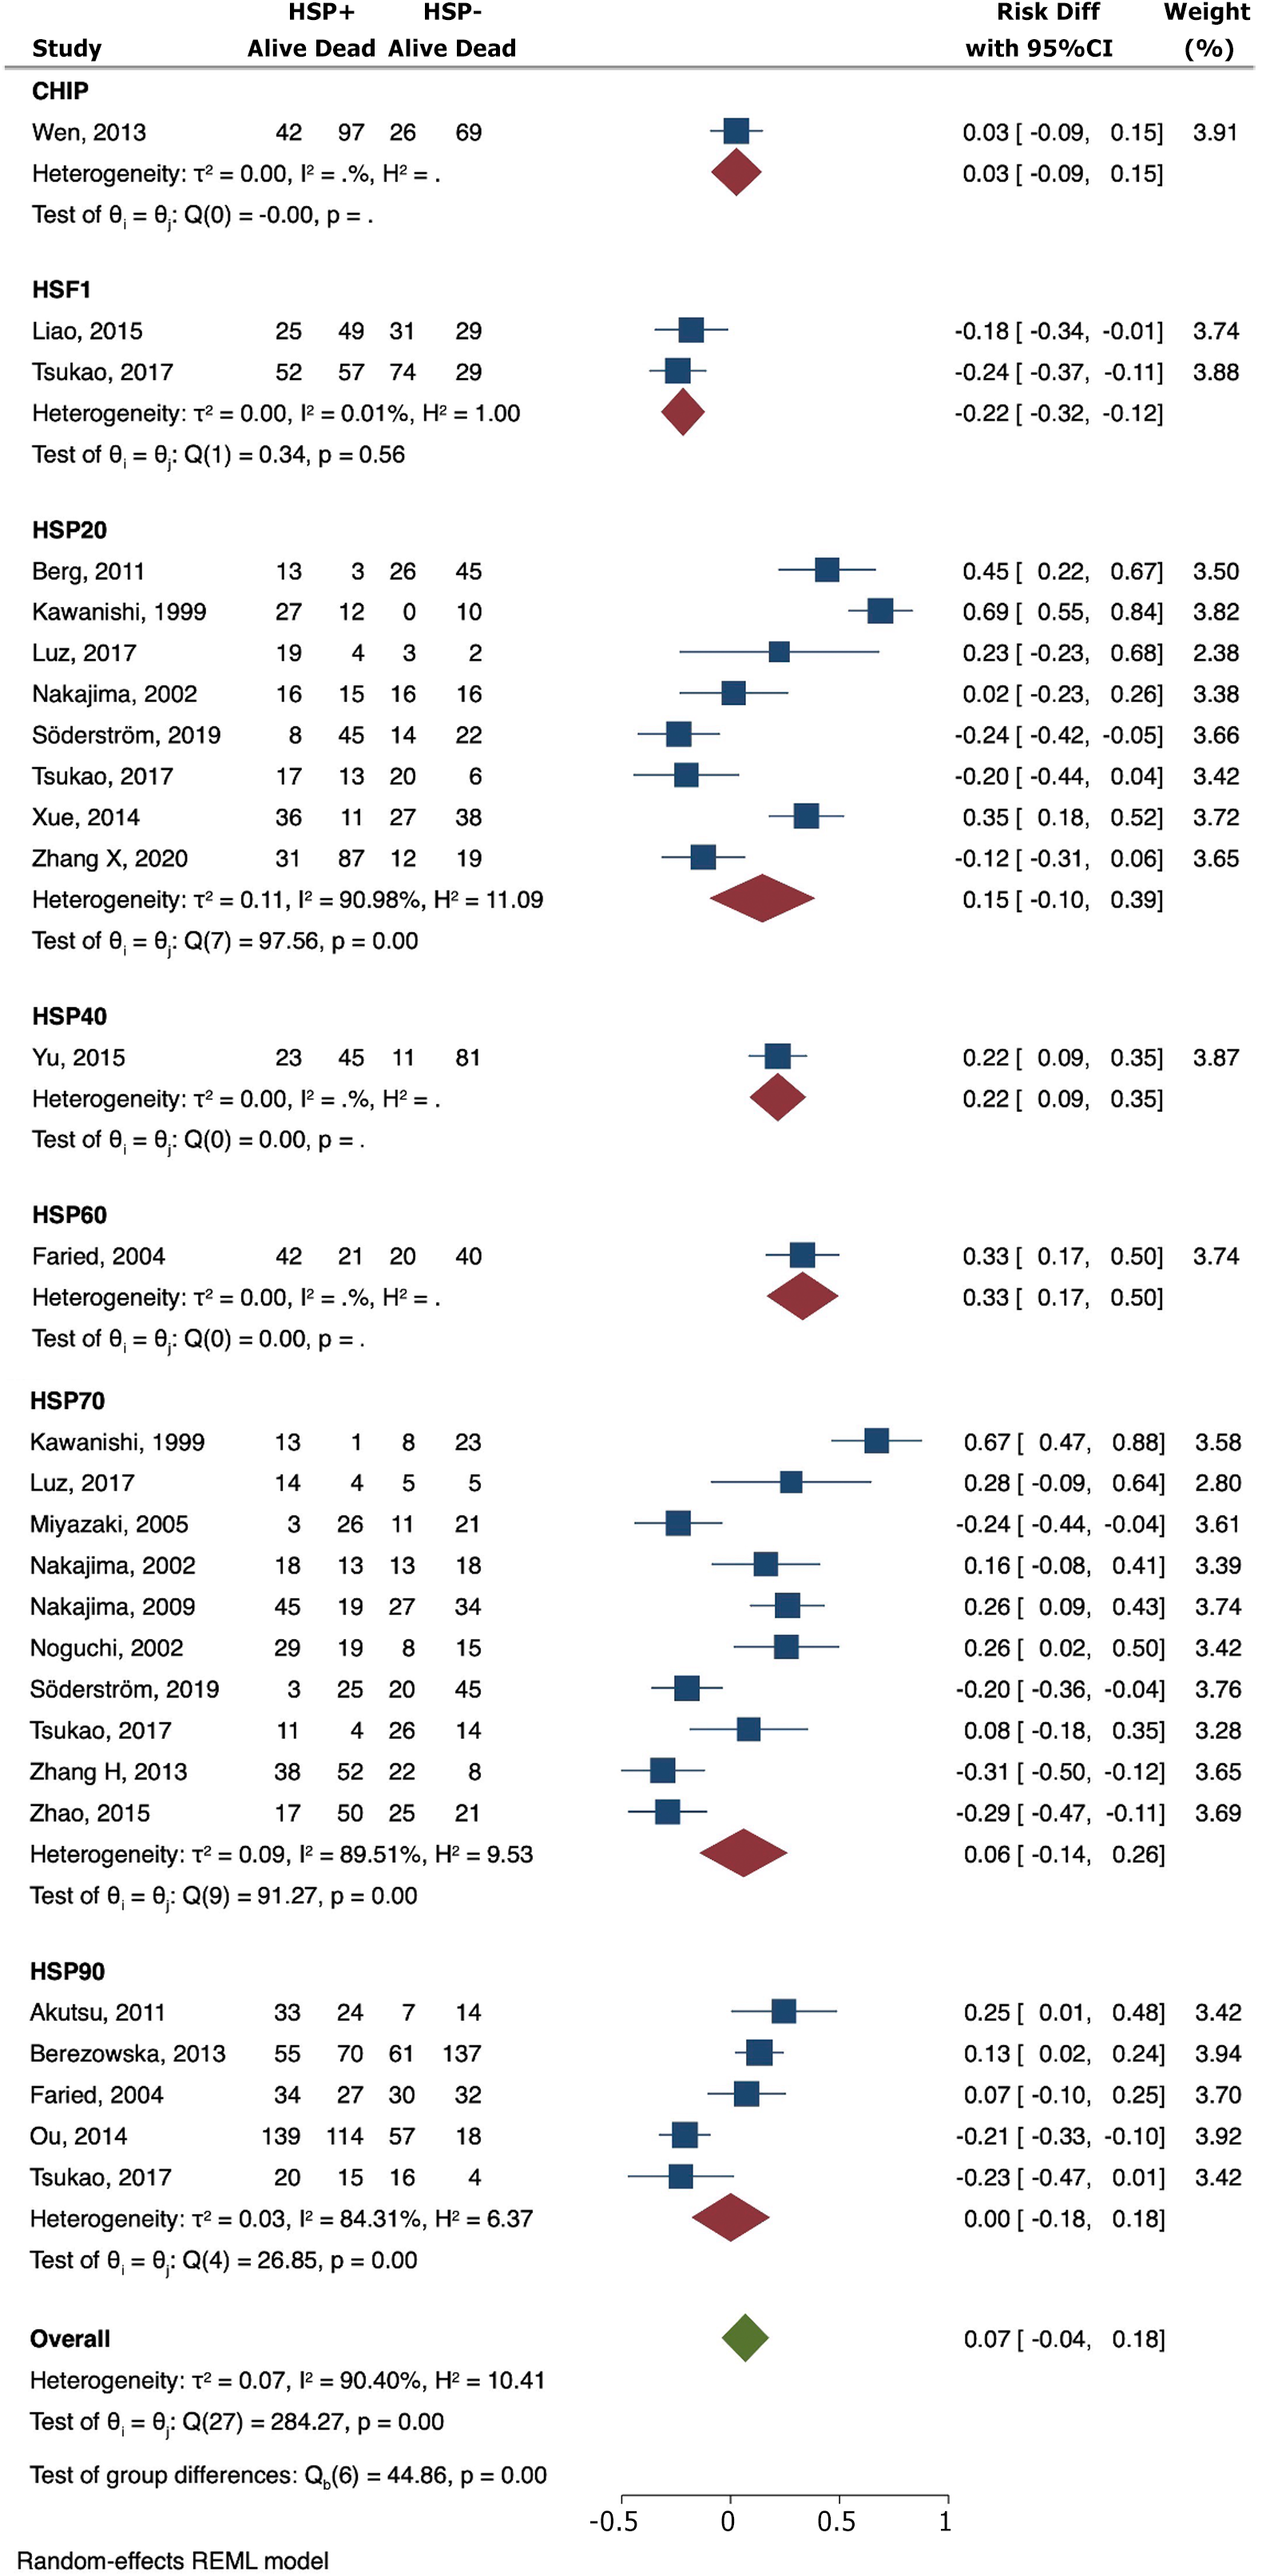
Figure 2 Forest plot of the eligible studies assessing the relationship between heat shock protein expression and overall survival.
HSP: Heat shock protein; CI: Confidence interval.
Figure 3 Forest plot of the eligible studies evaluating the association of the heat shock proteins with the grade of cellular differentiation and lymph node dissemination.
A: Forest plot of the eligible studies evaluating the association of the heat shock proteins with the grade of cellular differentiation; B: Forest plot of the eligible studies evaluating the association of the heat shock protein s with lymph node dissemination. HSP: Heat shock protein; CI: Confidence interval.
Figure 4 Forest plot of the eligible studies evaluating the association of heat shock proteins with tumor depth and distant metastasis.
A: Forest plot of the eligible studies evaluating the association of heat shock proteins with tumor depth; B: Forest plot of the eligible studies evaluating the association of heat shock proteins with distant metastasis. HSP: Heat shock protein; CI: Confidence interval.
- Citation: Nakamura ET, Park A, Pereira MA, Kikawa D, Tustumi F. Prognosis value of heat-shock proteins in esophageal and esophagogastric cancer: A systematic review and meta-analysis. World J Gastrointest Oncol 2024; 16(4): 1578-1595
- URL: https://www.wjgnet.com/1948-5204/full/v16/i4/1578.htm
- DOI: https://dx.doi.org/10.4251/wjgo.v16.i4.1578


