Copyright
©The Author(s) 2024.
World J Gastrointest Oncol. Apr 15, 2024; 16(4): 1309-1318
Published online Apr 15, 2024. doi: 10.4251/wjgo.v16.i4.1309
Published online Apr 15, 2024. doi: 10.4251/wjgo.v16.i4.1309
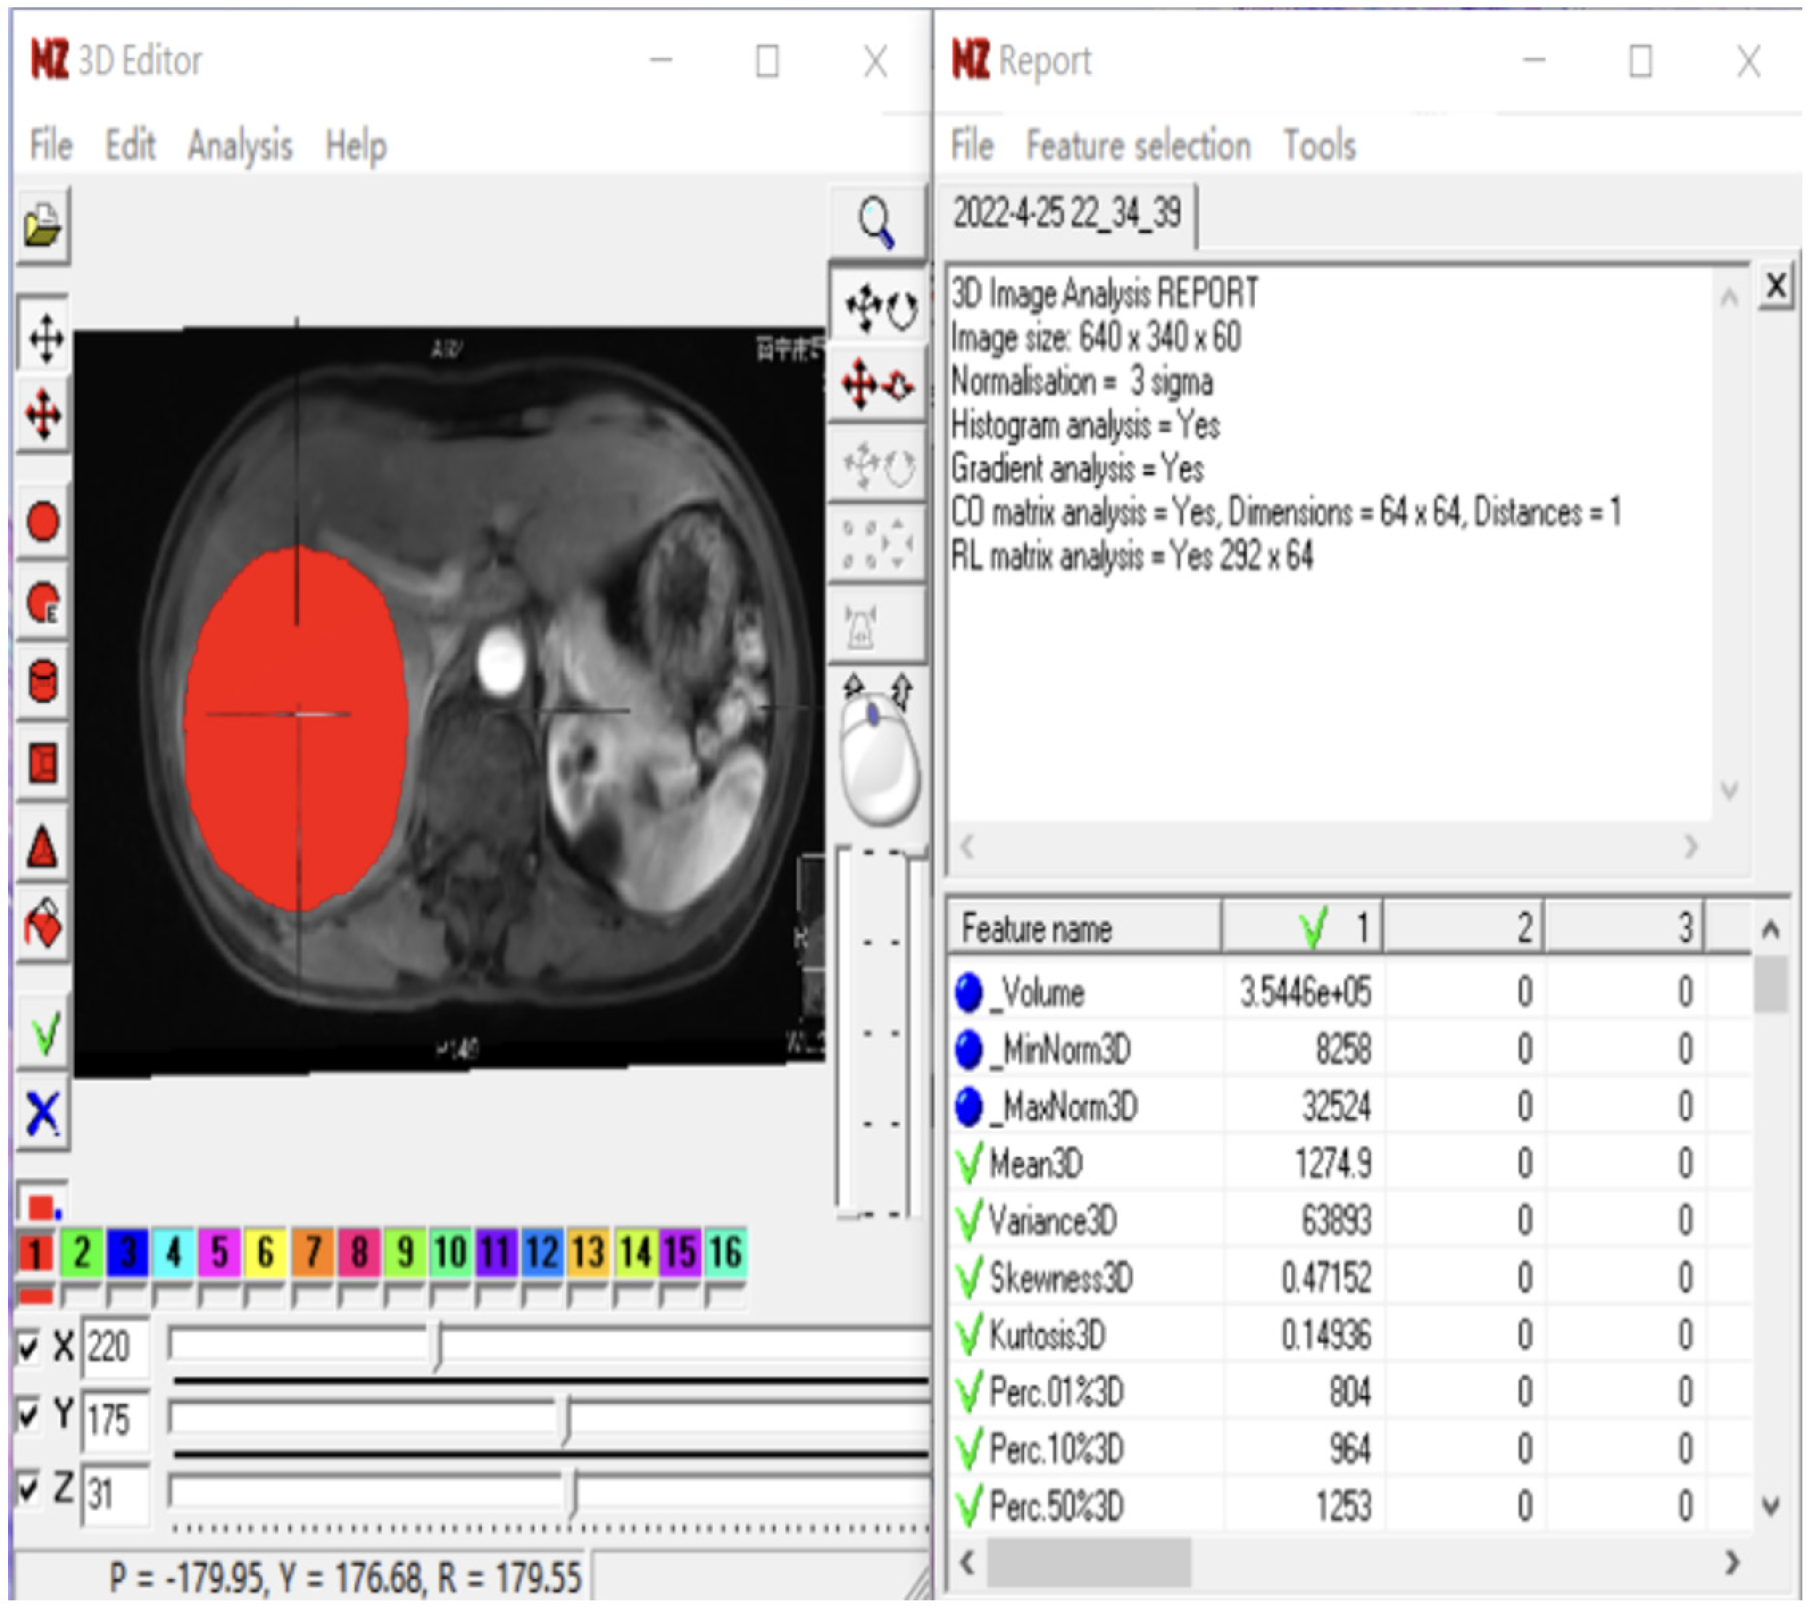
Figure 1 The volume area of interest generated from the texture analysis based on the magnetic resonance image, along with the extracted 3D texture features.
The figure includes extraction of 94 diverse texture features from the volume area of interest (VOI) and a reporting window that details the VOI placement and texture feature extraction process (such as basic image details, types of texture features, specific texture characteristics, and their corresponding parameter values).
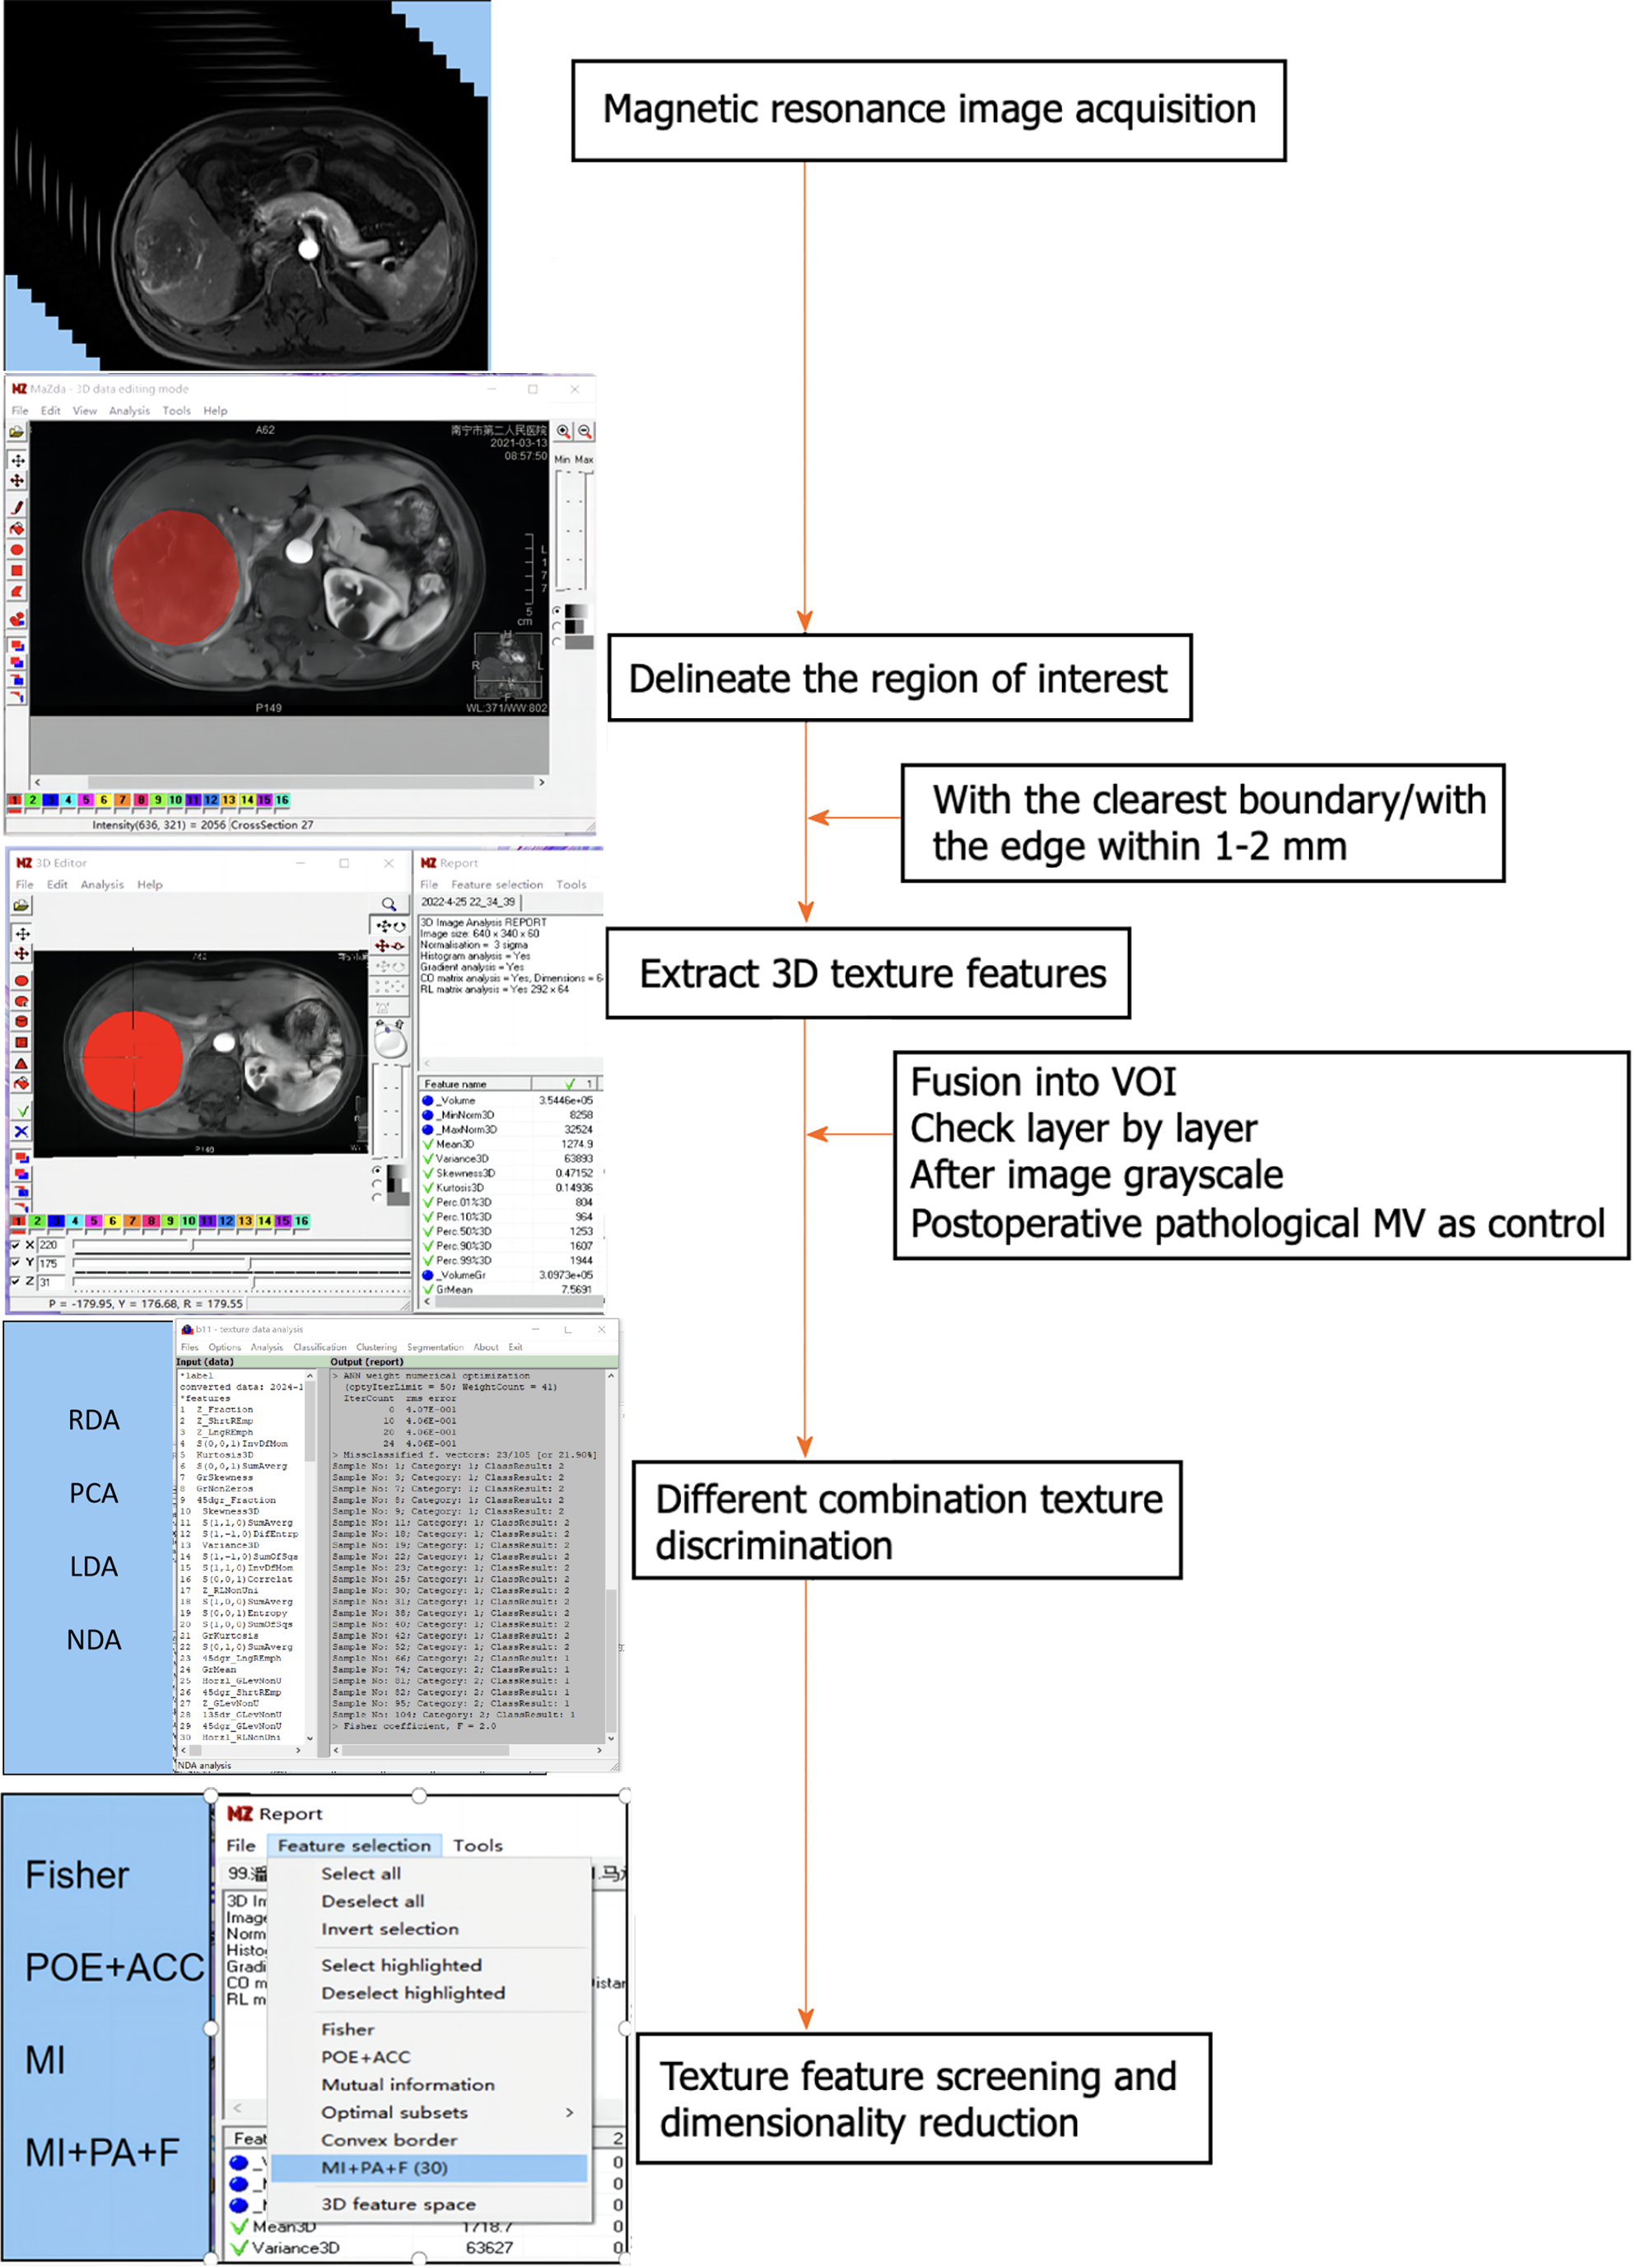
Figure 2 The workflow of texture analysis based on magnetic resonance images.
VOI: Volume area of interest; MV: Microvascular.
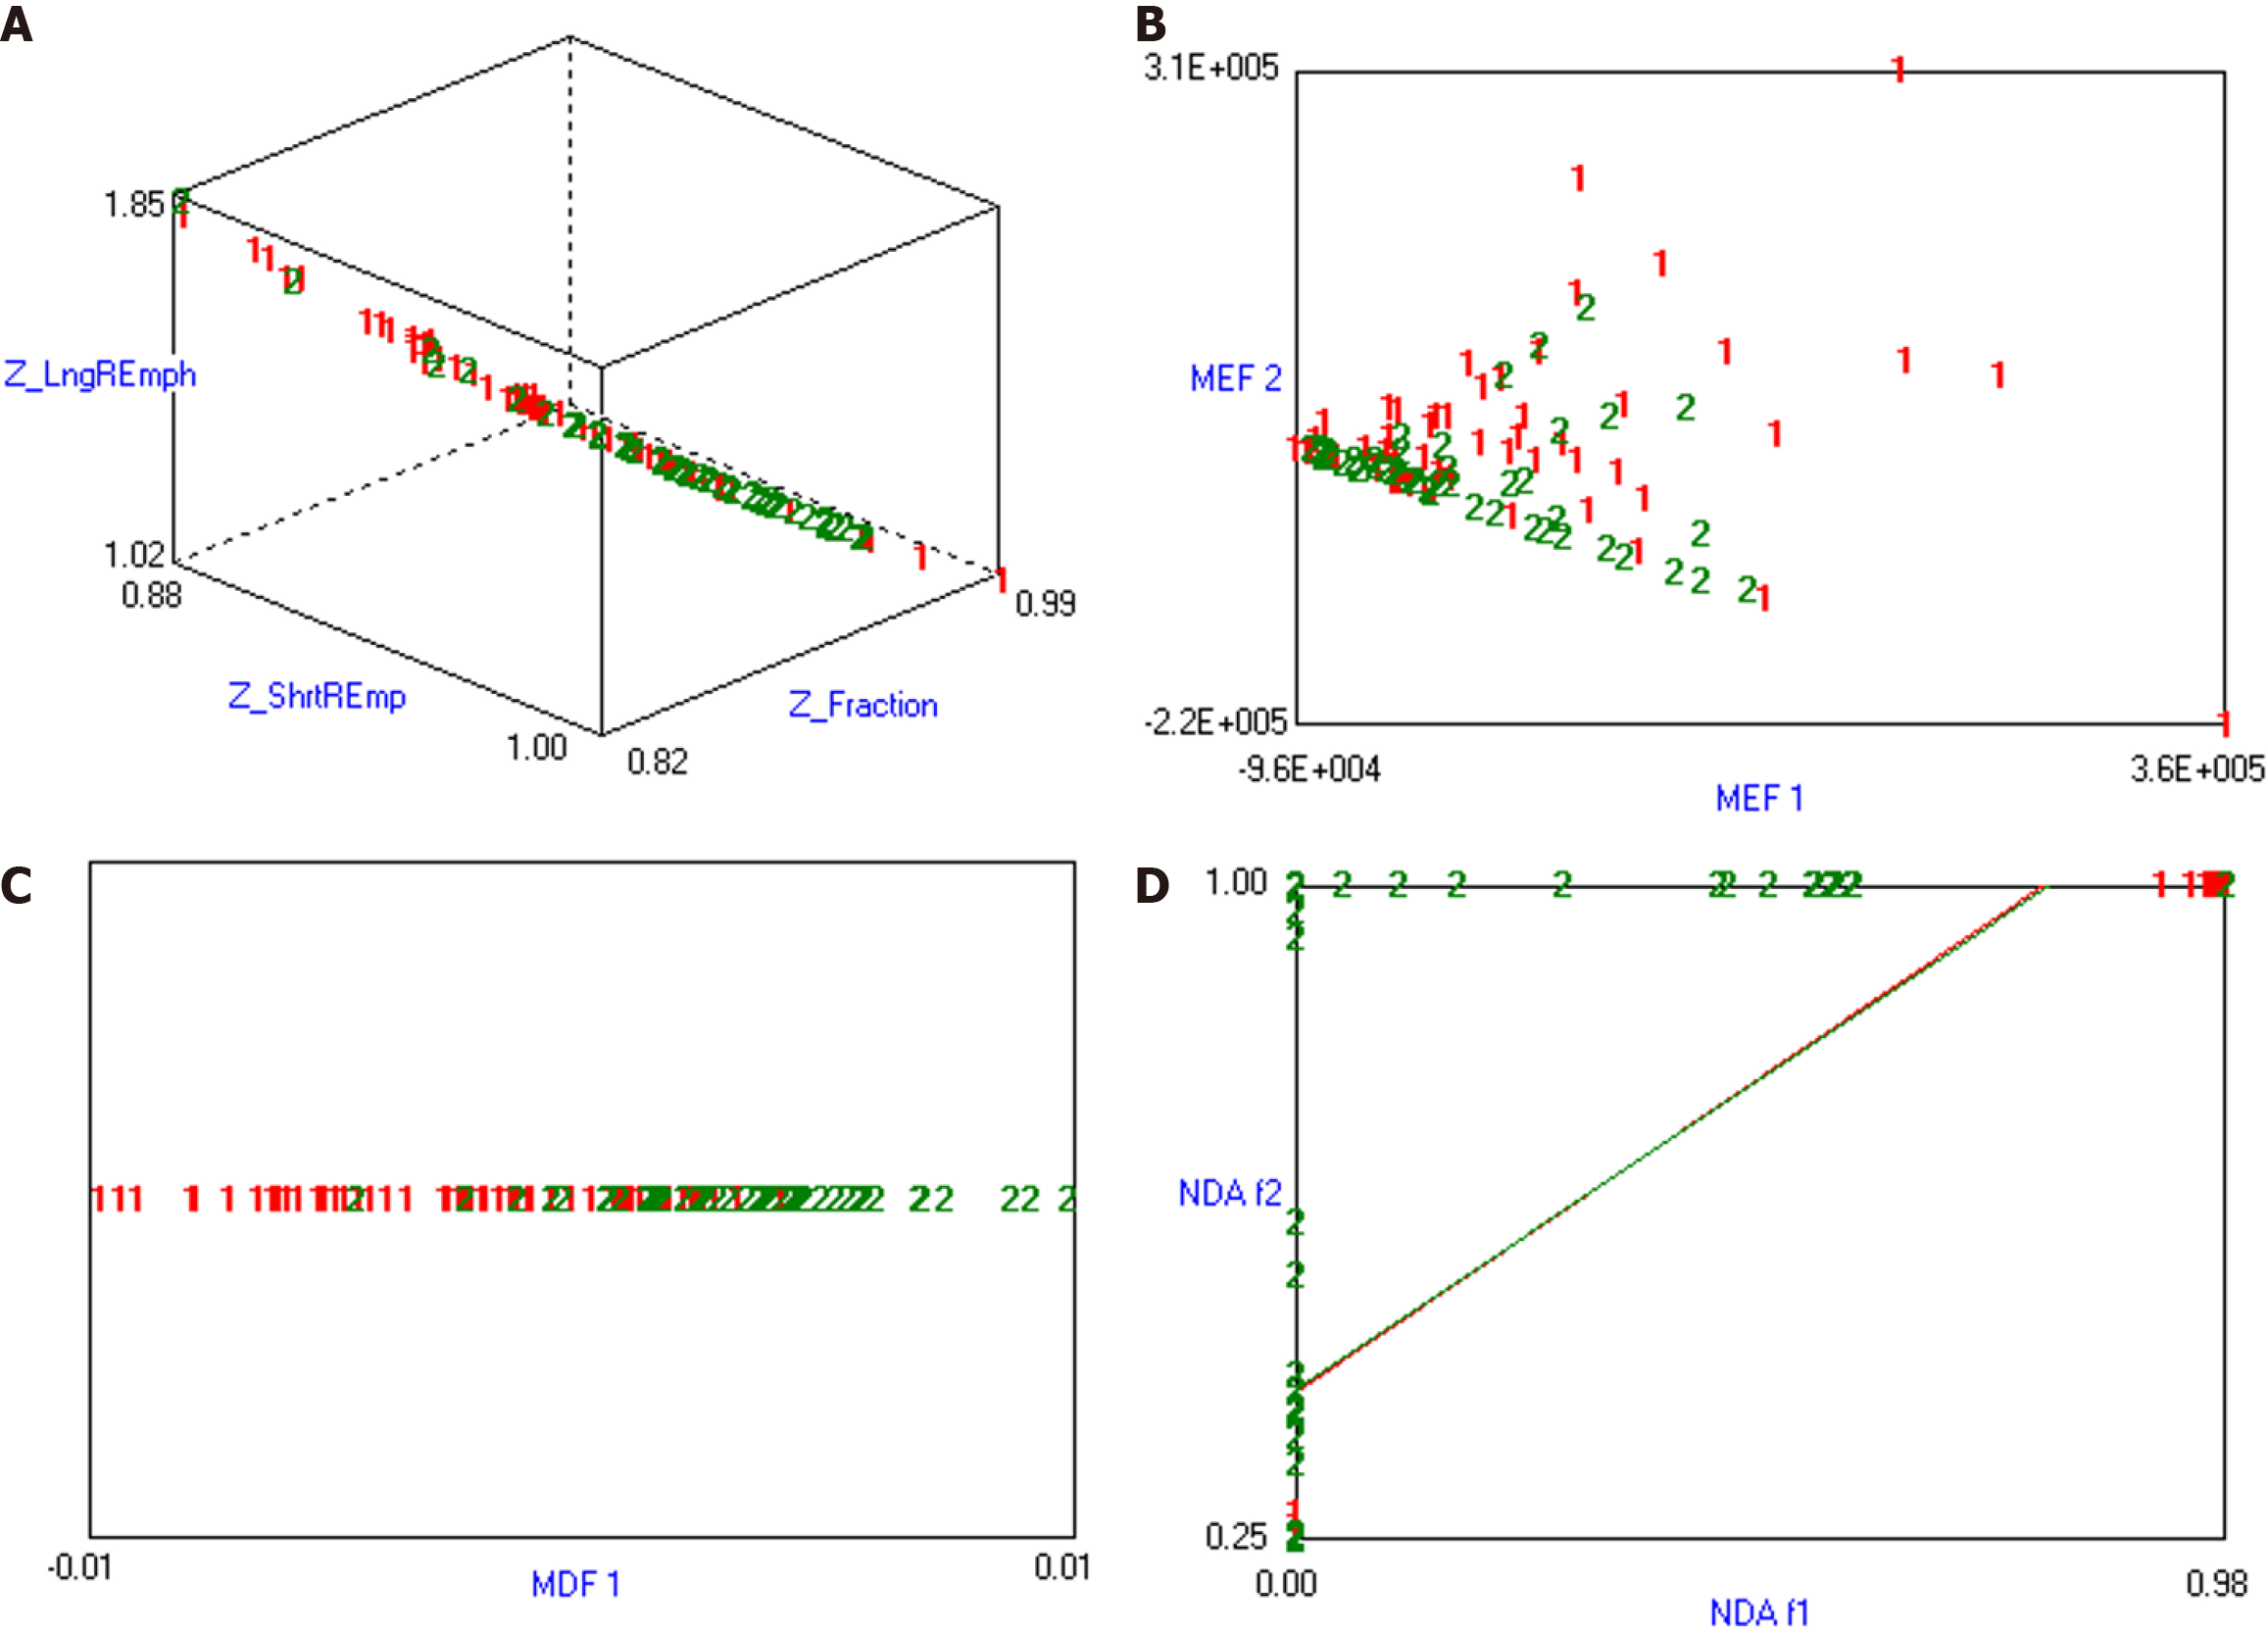
Figure 3 The visualization of the predicted results based on magnetic resonance arterial phase image analysis.
A: The log grayscale analysis; B: The MEF grayscale analysis; C: The MDF grayscale analysis; D: The Non-Linear Discriminant Analysis.
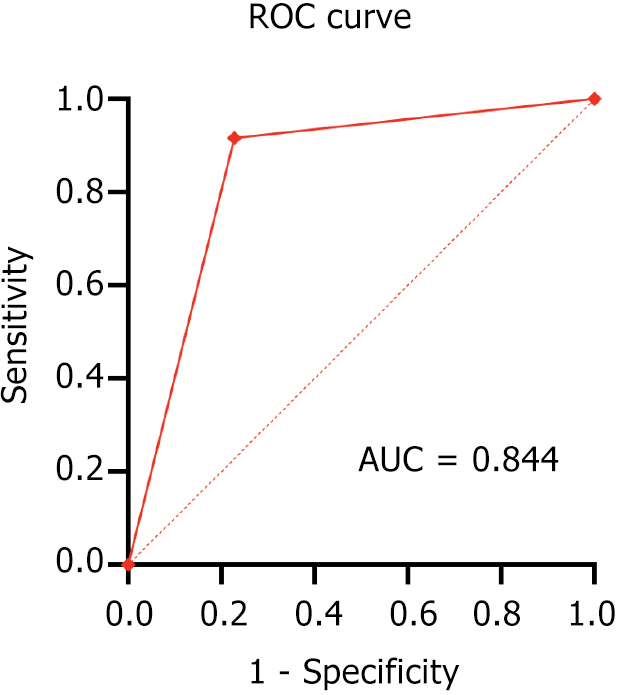
Figure 4 Receiver operating characteristic curve analysis based on binomial logistic regression analysis.
ROC: Receiver operating characteristic; AUC: Area under the curve.
- Citation: Nong HY, Cen YY, Qin M, Qin WQ, Xie YX, Li L, Liu MR, Ding K. Application of texture signatures based on multiparameter-magnetic resonance imaging for predicting microvascular invasion in hepatocellular carcinoma: Retrospective study. World J Gastrointest Oncol 2024; 16(4): 1309-1318
- URL: https://www.wjgnet.com/1948-5204/full/v16/i4/1309.htm
- DOI: https://dx.doi.org/10.4251/wjgo.v16.i4.1309


