Copyright
©The Author(s) 2024.
World J Gastrointest Oncol. Mar 15, 2024; 16(3): 833-843
Published online Mar 15, 2024. doi: 10.4251/wjgo.v16.i3.833
Published online Mar 15, 2024. doi: 10.4251/wjgo.v16.i3.833
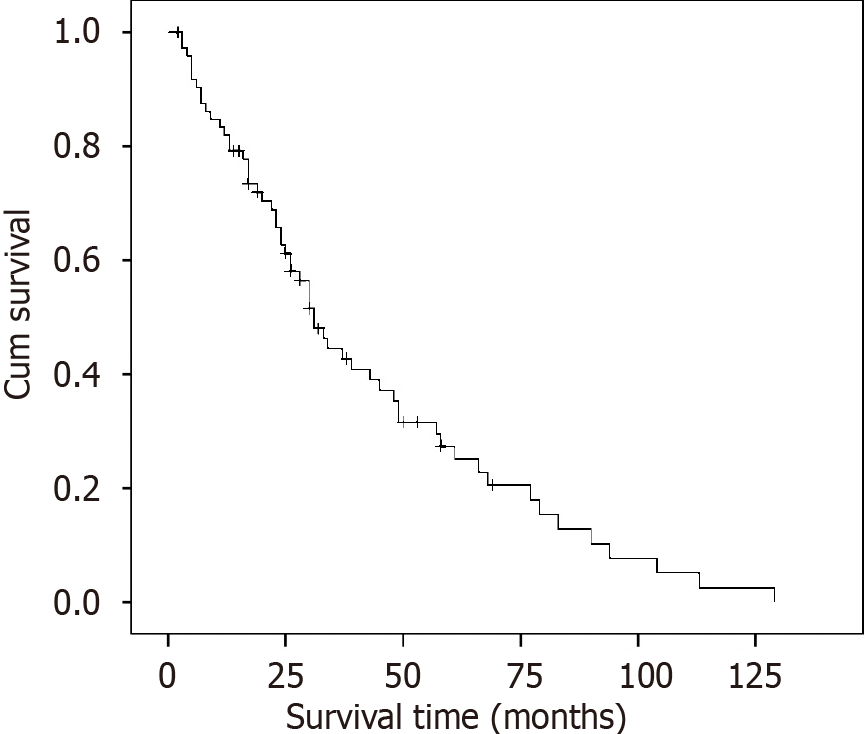
Figure 1 Kaplan-Meier curves of overall survival for all patients.
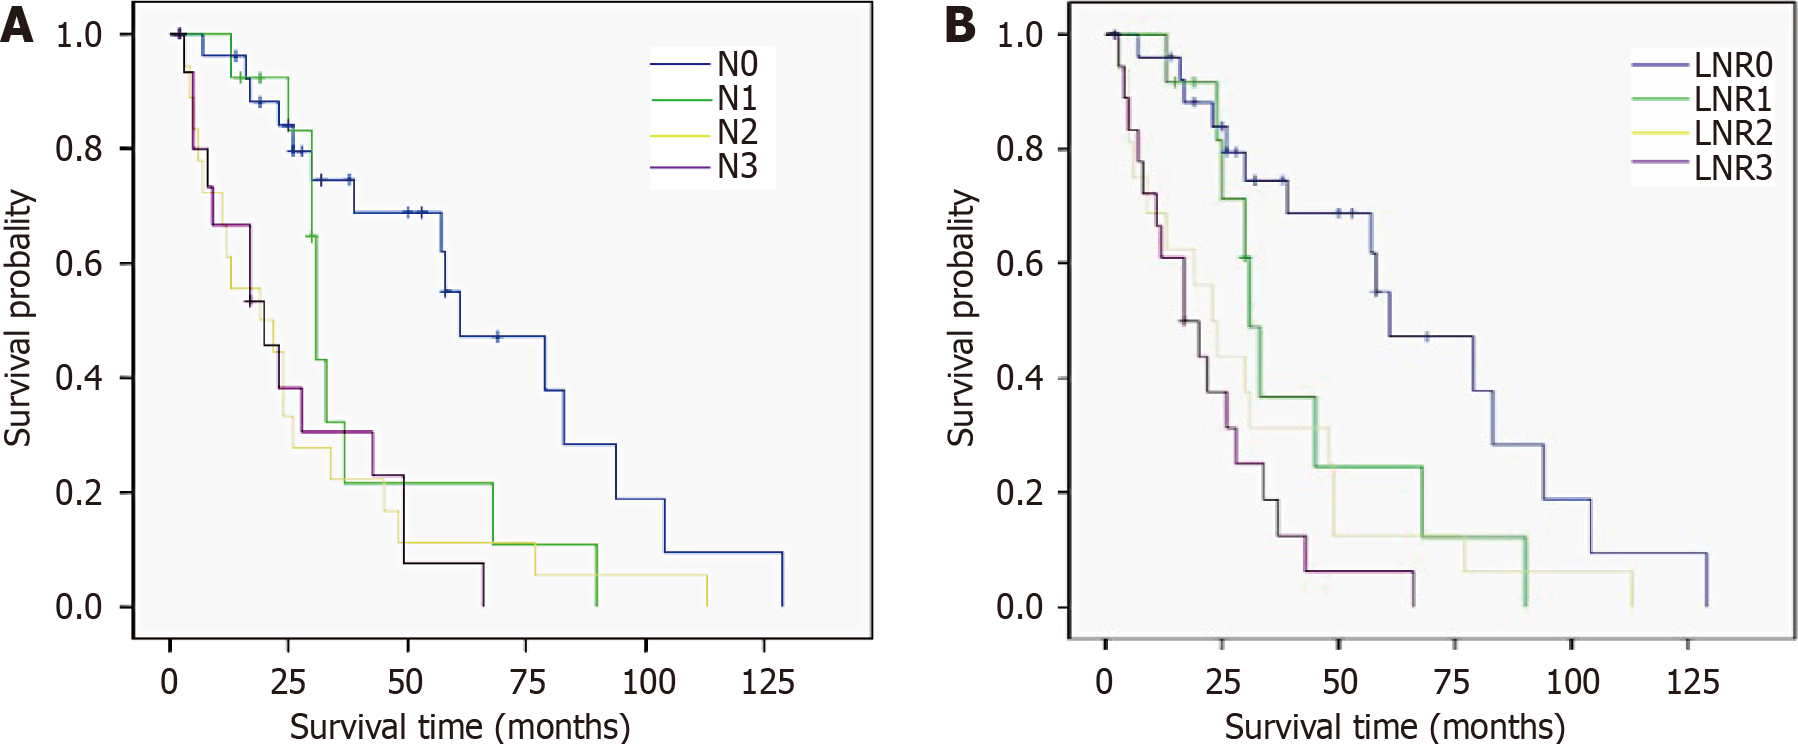
Figure 2 Kaplan-Meier curves according to lymph node stage and lymph node ratio stage.
Comparison of survival curves according to the lymph node stages (N stages) and lymph node ratio (LNR) stages (both P < 0.001). A: Survival curves of patients with various N stages; B: Survival curves of patients with various LNR stages. N: Lymph node stage; LNR: Lymph node ratio.
- Citation: Zhuo M, Tian L, Han T, Liu TF, Lin XL, Xiao XY. Predictive value of positive lymph node ratio in patients with locally advanced gastric remnant cancer. World J Gastrointest Oncol 2024; 16(3): 833-843
- URL: https://www.wjgnet.com/1948-5204/full/v16/i3/833.htm
- DOI: https://dx.doi.org/10.4251/wjgo.v16.i3.833


