Copyright
©The Author(s) 2024.
World J Gastrointest Oncol. Mar 15, 2024; 16(3): 798-809
Published online Mar 15, 2024. doi: 10.4251/wjgo.v16.i3.798
Published online Mar 15, 2024. doi: 10.4251/wjgo.v16.i3.798
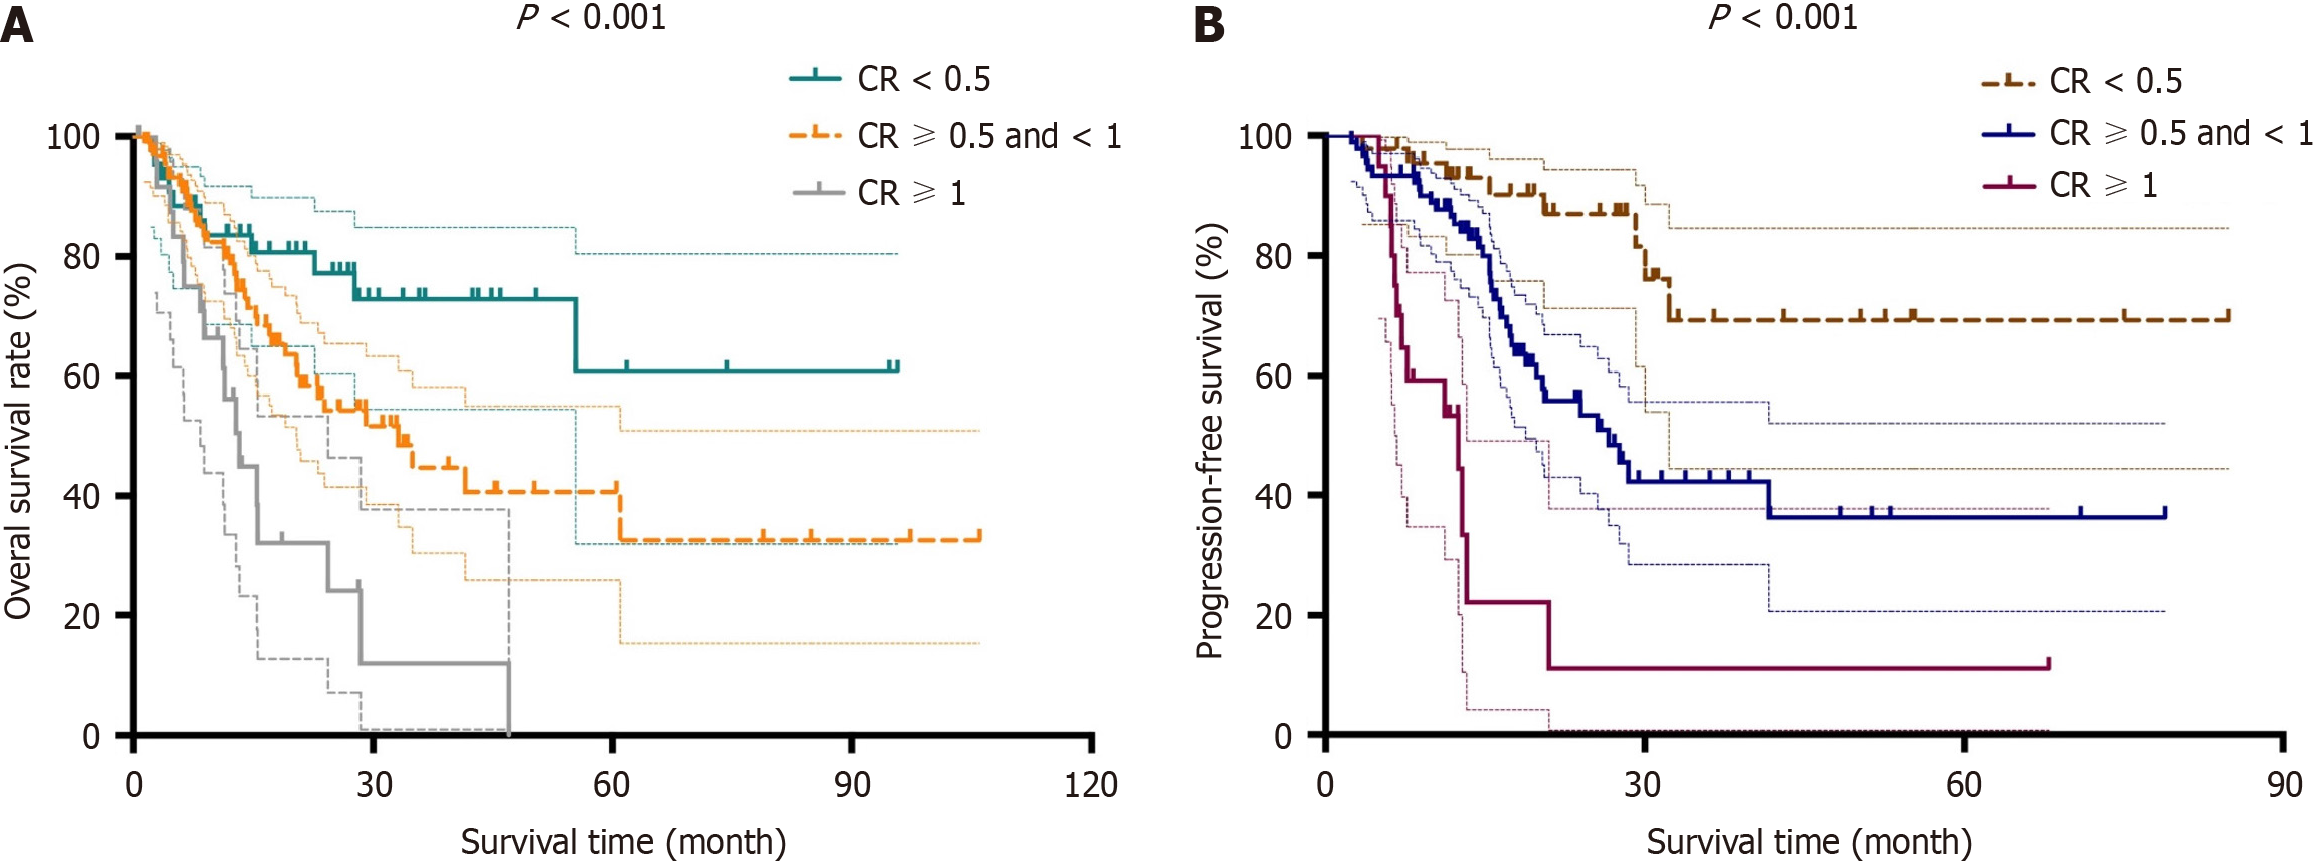
Figure 1 Kaplan-Meier curves for patients according to carbohydrate antigen 19-9.
A and B: Kaplan-Meier curves for overall survival (A) and disease-free survival (B) are presented for post-neoadjuvant therapy (NAT) serum carbohydrate antigen 19-9 (CA19-9) level/pre-NAT serum CA19-9 level, which was defined as the carbohydrate antigen 19-9 ratio (CR).
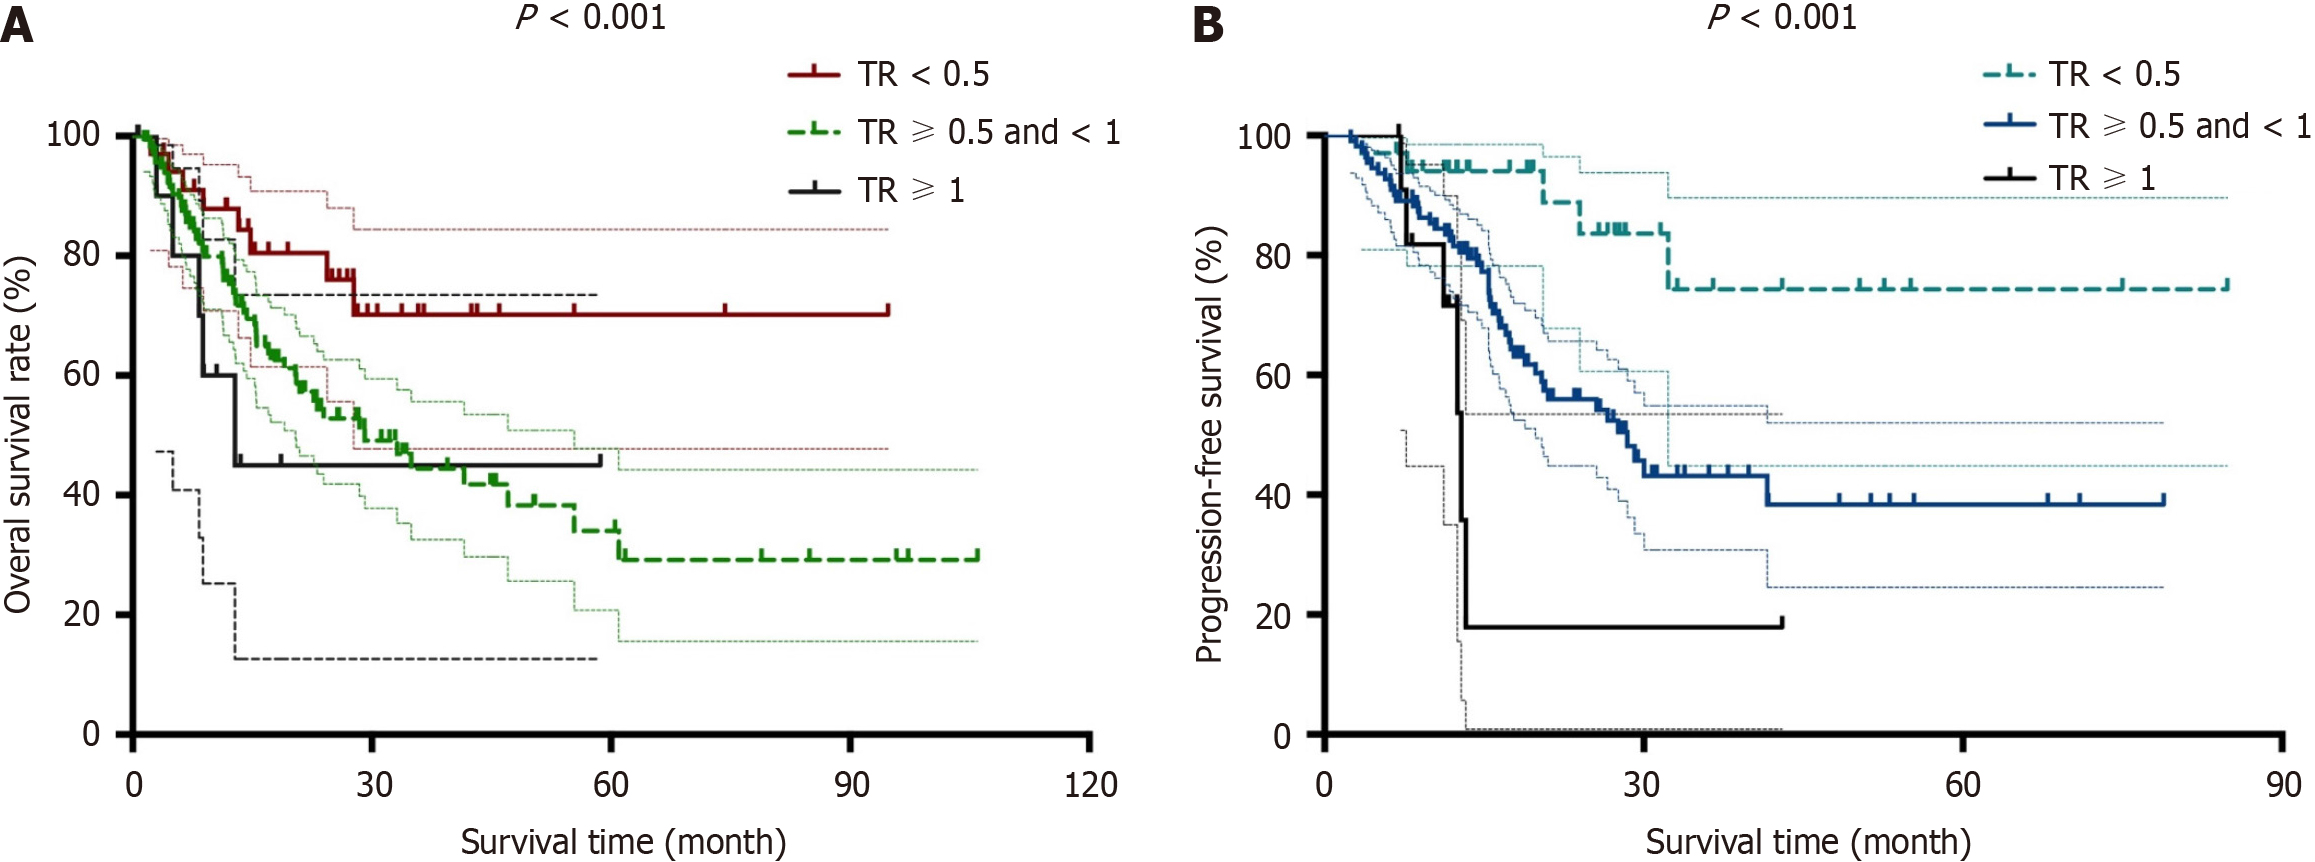
Figure 2 Kaplan-Meier curves for patients according to tumor size.
A and B: Kaplan-Meier curves for overall survival (A) and disease-free survival (B) are presented for post-neoadjuvant therapy (NAT) tumor size/pre-NAT tumor size, which was defined as tumor size ratio (TR).
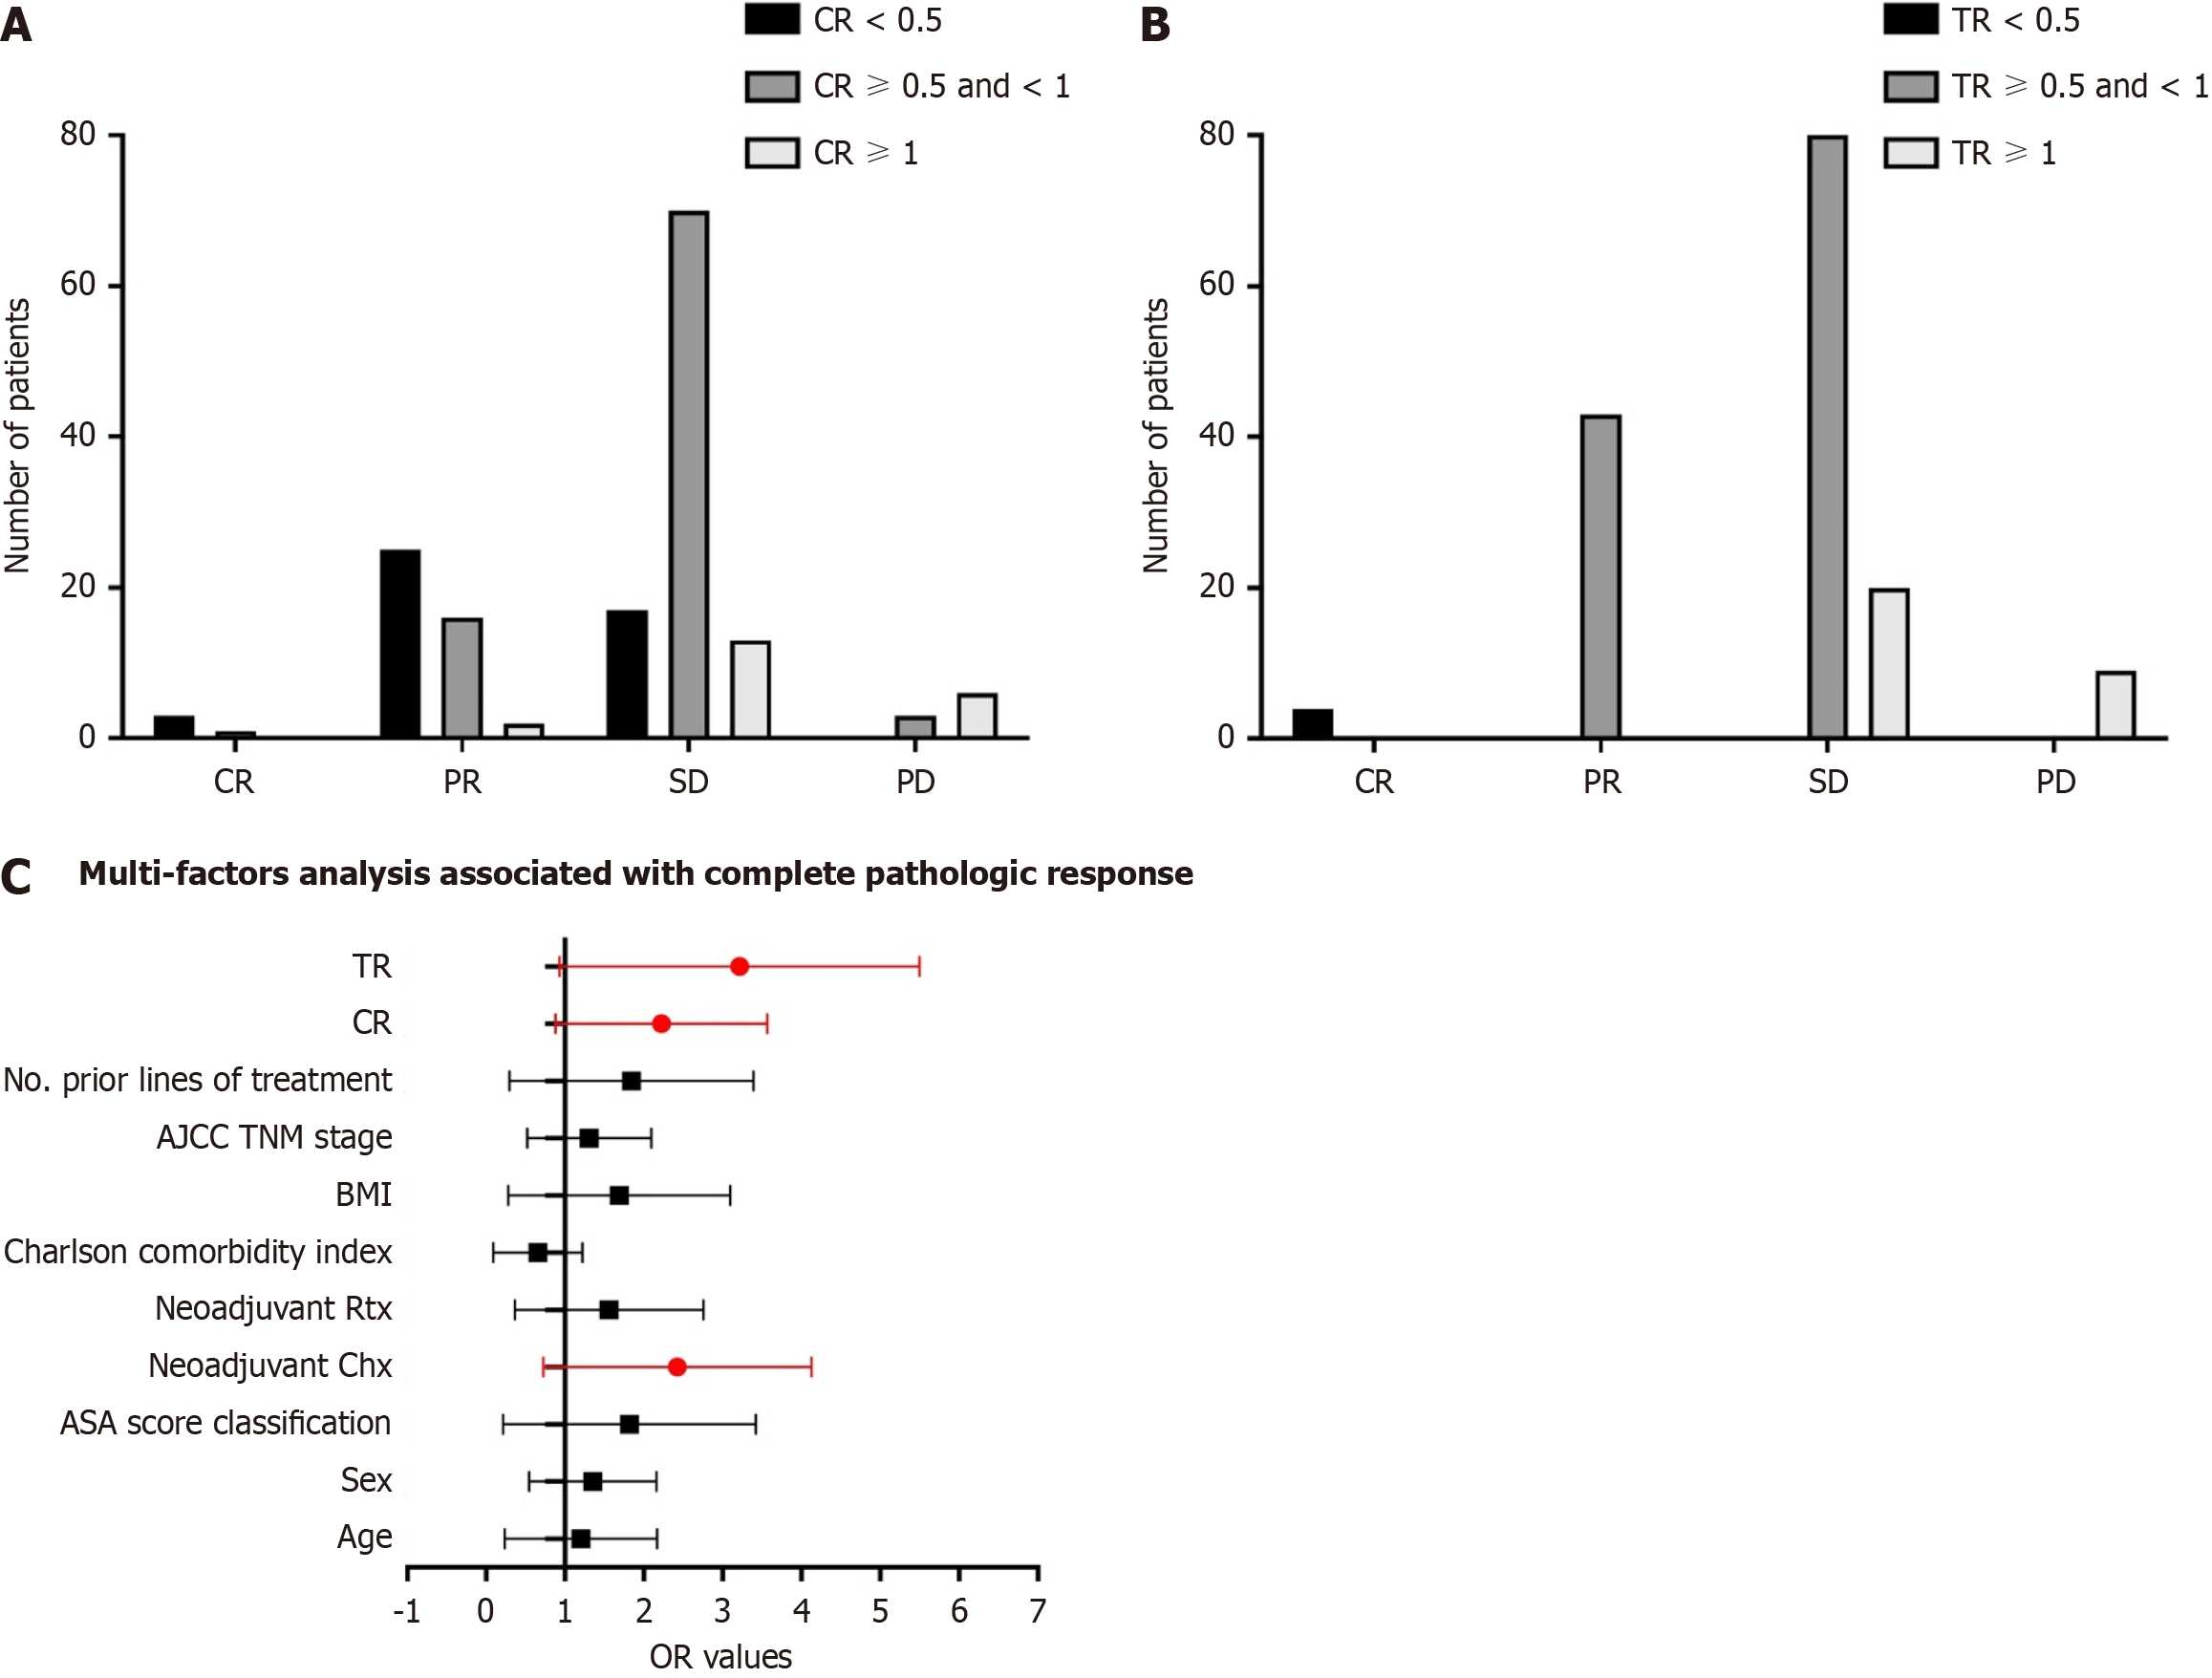
Figure 3 Treatment efficacy of all patients based on the groups divided by carbohydrate antigen 19-9 ratio and tumor size ratio.
A: Treatment efficacy based on the groups divided by carbohydrate antigen 19-9 ratio (CR); B: Treatment efficacy based on the groups divided by tumor size ratio (TR); C: Multivariable analysis showed that CR and TR of neoadjuvant therapy were associated with increased odds of achieving a complete or near-complete pathologic response. AJCC: American Joint Committee on Cancer; BMI: Body mass index; PD: Progressive disease; SD: Stable disease.
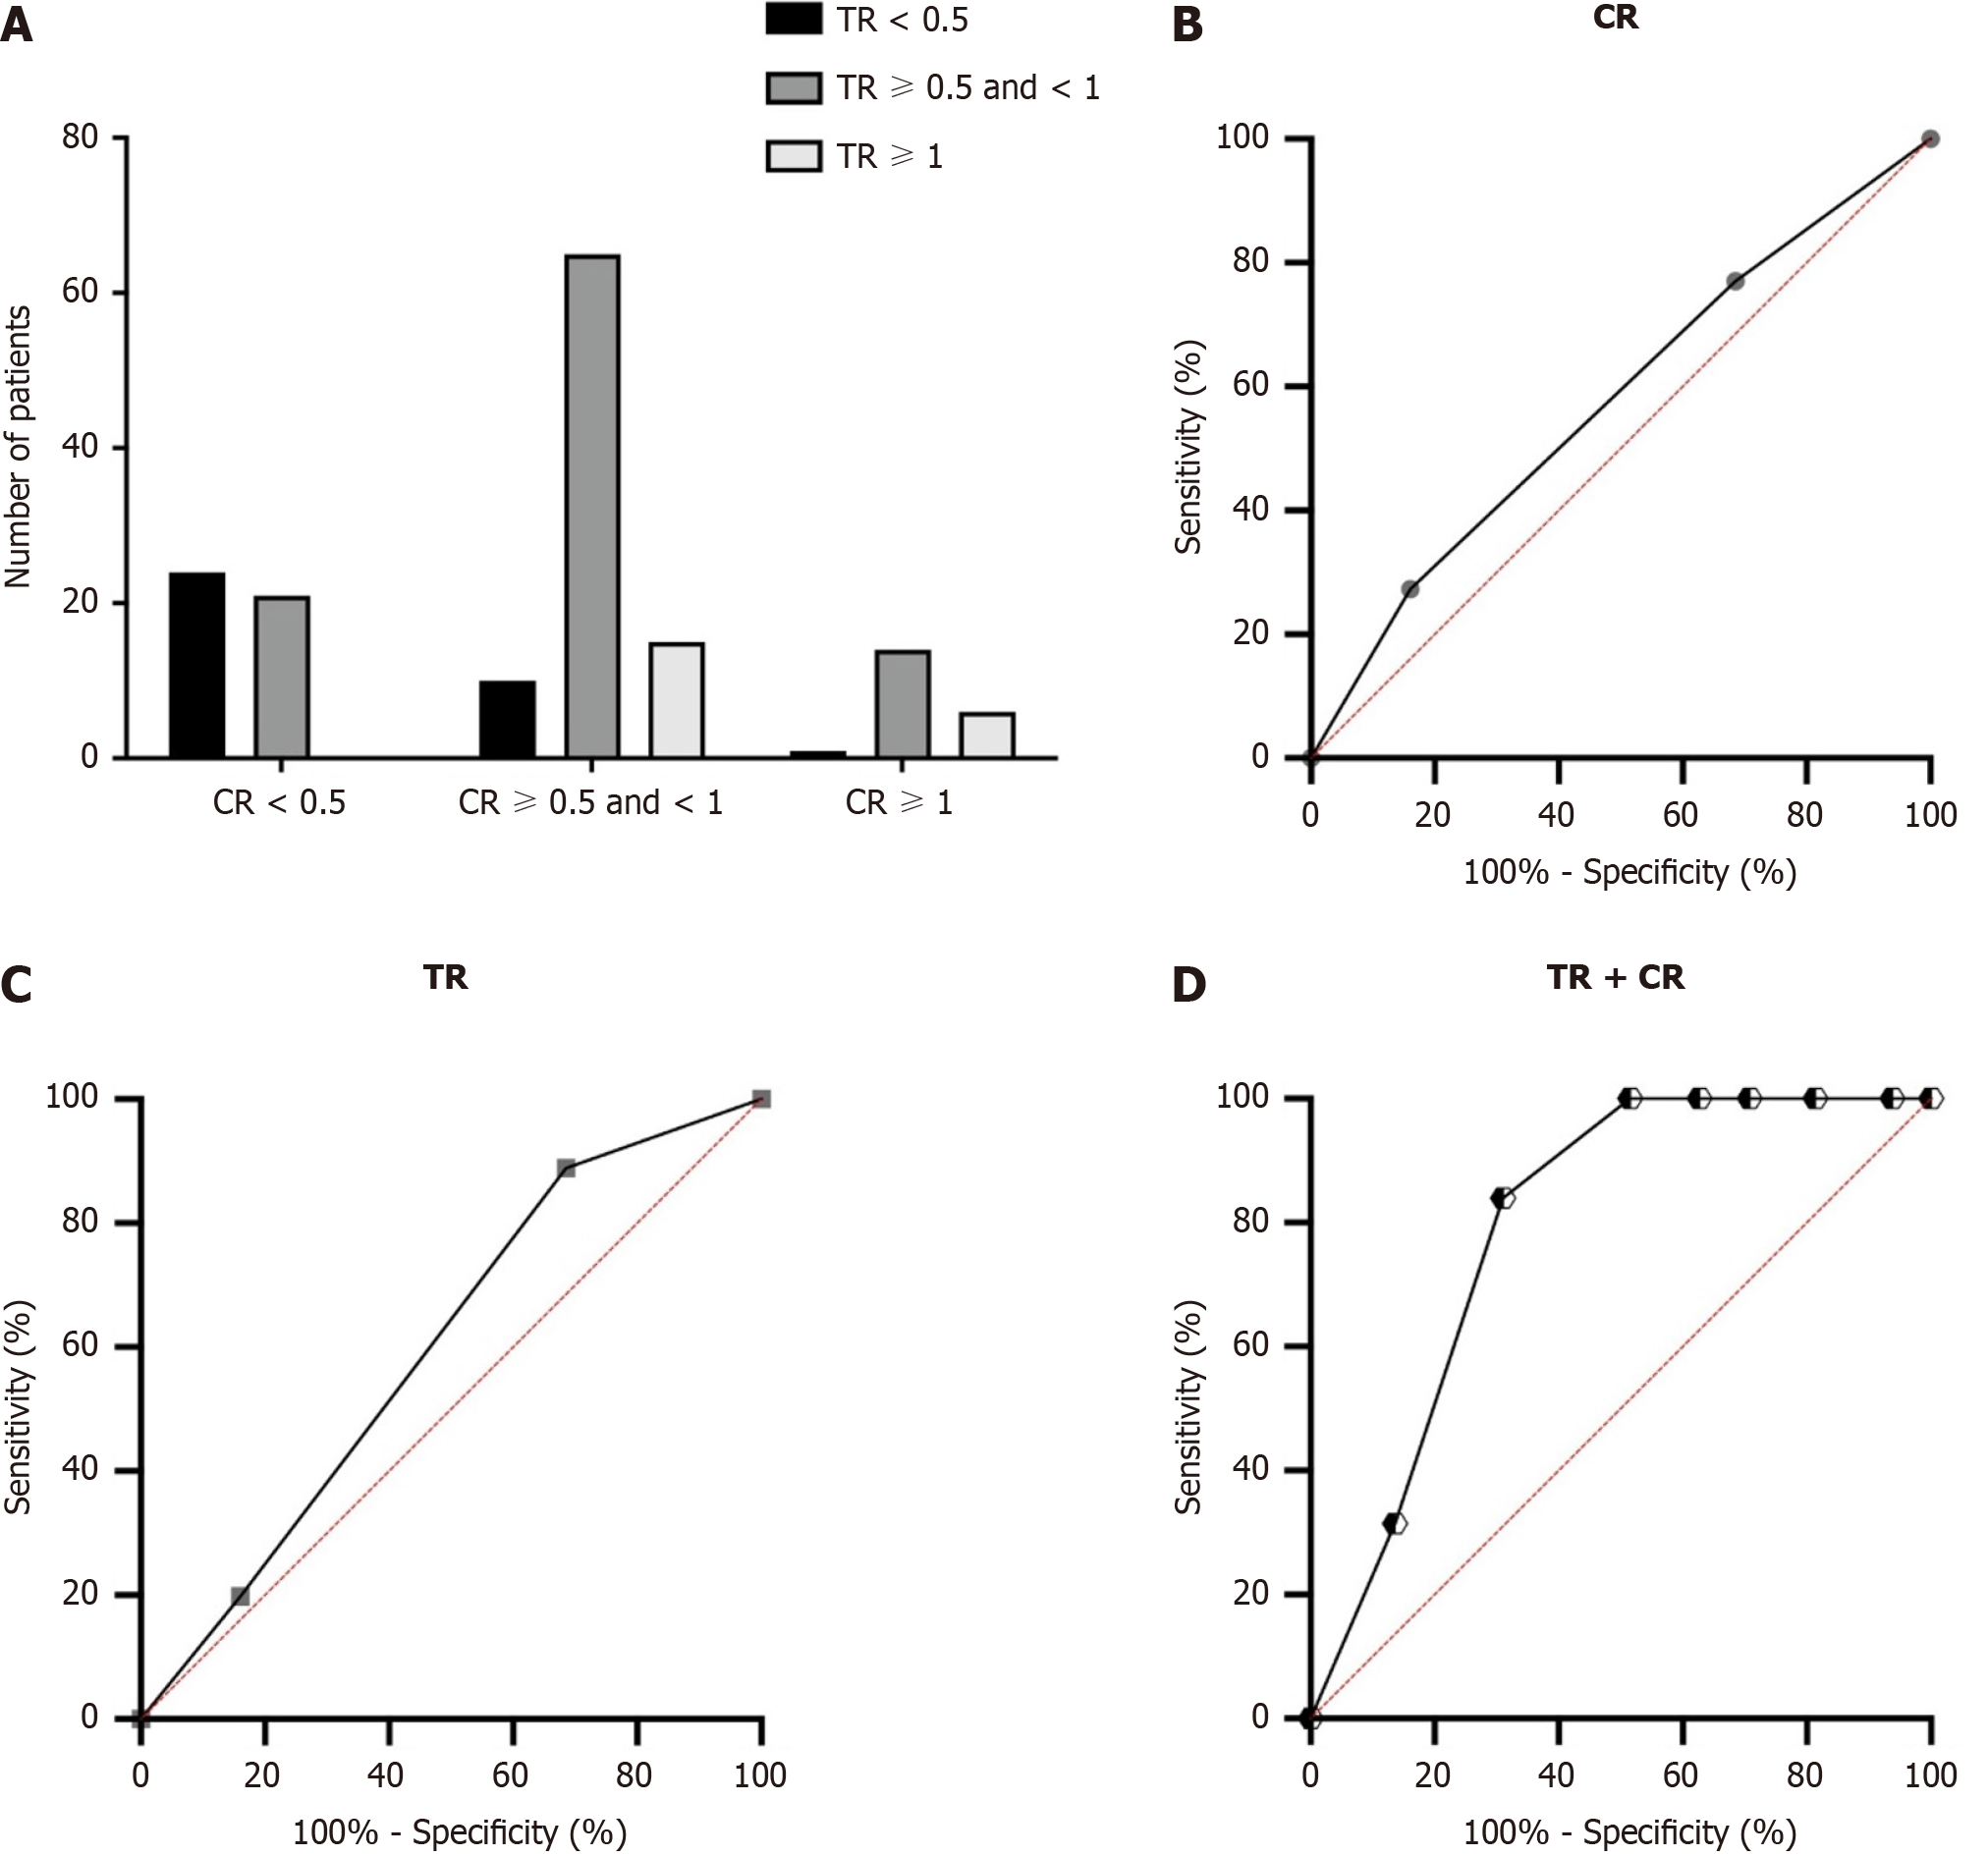
Figure 4 Prognostic values for both carbohydrate antigen 19-9 ratio and tumor size ratio.
A-D: Interaction between carbohydrate antigen 19-9 ratio (CR) and tumor size ratio (TR; A) and area under the receiver operating characteristic curves performed to compare the predictive overall survival values of the variable of CR (B), TR (C) and the combined predictive value of CR and TR (D).
- Citation: Xia DQ, Zhou Y, Yang S, Li FF, Tian LY, Li YH, Xu HY, Xiao CZ, Wang W. Combining prognostic value of serum carbohydrate antigen 19-9 and tumor size reduction ratio in pancreatic ductal adenocarcinoma. World J Gastrointest Oncol 2024; 16(3): 798-809
- URL: https://www.wjgnet.com/1948-5204/full/v16/i3/798.htm
- DOI: https://dx.doi.org/10.4251/wjgo.v16.i3.798


